| Mass Transportation in one image
Description
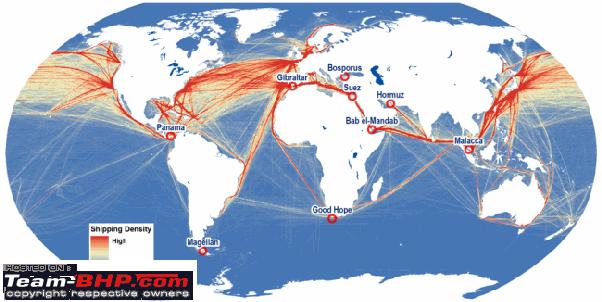
This image of the Night time Lights has overlays showing the human footprint of global transportation on land, in the air, and by sea. The base map of this image shows nighttime lights visible from space, which indicates areas where people live, work, and consume energy. Red lines represent 87,000 daily flights connecting cities and cultures around the world. Blue lines represent the paths of 3500 commercial vessels over the course of a year, which is only 10% of the total ocean shipping traffic. Green lines represent the world's roads, used by over 1 billion motor vehicles. This colorful globe shows the interconnected nature of the world, but also how much energy we use to move people and goods around the planet's surfac
Notable Features
The base map of this image shows night time lights visible from space, which indicates areas where people live, work, and consume energy.
Red lines represent 87,000 daily flights connecting cities and cultures around the world.
Blue lines represent the paths of 3500 commercial vessels over the course of a year, which is only 10% of the total ocean shipping traffic.
Green lines represent the world's roads, used by over 1 billion motor vehicles.
SOURCE : https://sos.noaa.gov/datasets/human-transportation/
MODS : Kindly post in a related thread, if needed, as i was unable to find it. | 

 21st November 2017, 20:09

 (8)
Thanks
(8)
Thanks