Team-BHP
(
https://www.team-bhp.com/forum/)
I have done the Ranking calculation based on the Revenue, like last month (see the link to the posts).
http://www.team-bhp.com/forum/indian...ml#post4053690 http://www.team-bhp.com/forum/indian...ml#post4055332 Methodology:
Calculation of Revenue for each of the cars, based on the 75th Percentile of all the variants of the Ex-Showroom price minus the Excise duty.
Since, the excise duty is already part of Ex-showroom price, so the calculation should be Factory price + Excise duty = Ex-Showroom price. To calculate that, we can divide the current 75 Percentile amount of Ex-Showroom price with the (Excise % / 100) value.
I have used the Avg. Ex-Showroom Price from Carwale.com (instead of Delhi) for all the cars and for all the variants, in order to calculate the 75th Percentile value.
In the below images, I have also given the Price of Base Variant, Top Variant and their Median and 75th Percentile Price and the Final Price along with the Excise Duty %, for easy understanding. The revenues are then calculated by multiplying the number of units with the Final Price to get the total revenue generated by the car.
Please note that these are just some approximate values and the actual revenues for each car may vary which only the Manufacturers would know. This exercise is solely to find out how the Cars and OEMs will be ranked and whether the actual volumes will convert in to revenues.
Also for some of the cars, there was a confusion in Excise % since one of the Petrol/Diesel versions might fall into some other duty bracket, for which I have taken a median value of them. This may not distort the figures much, but there might be some discrepancy.
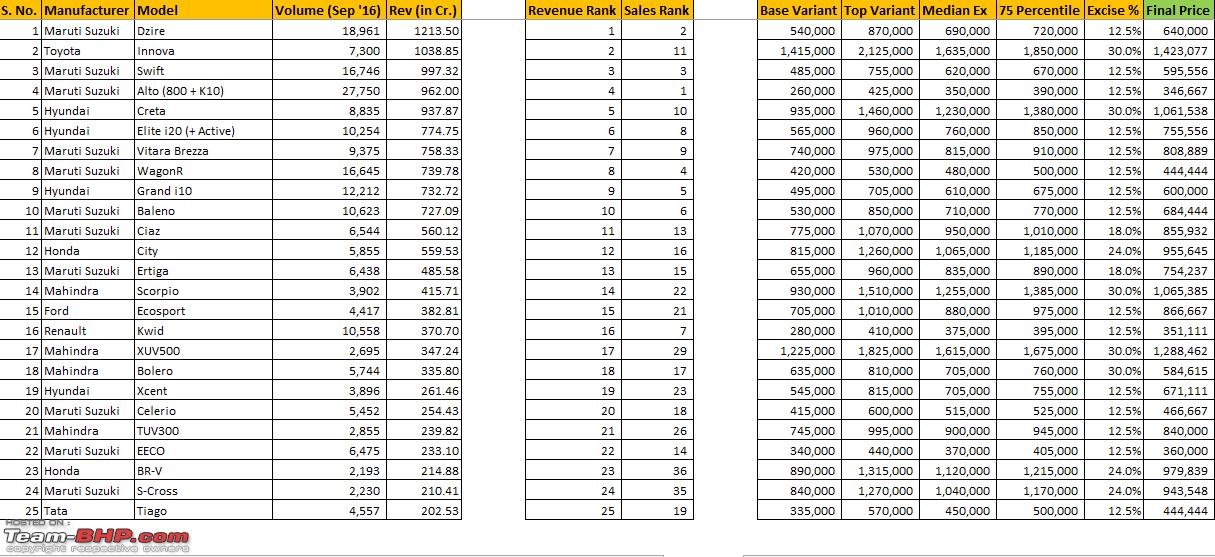
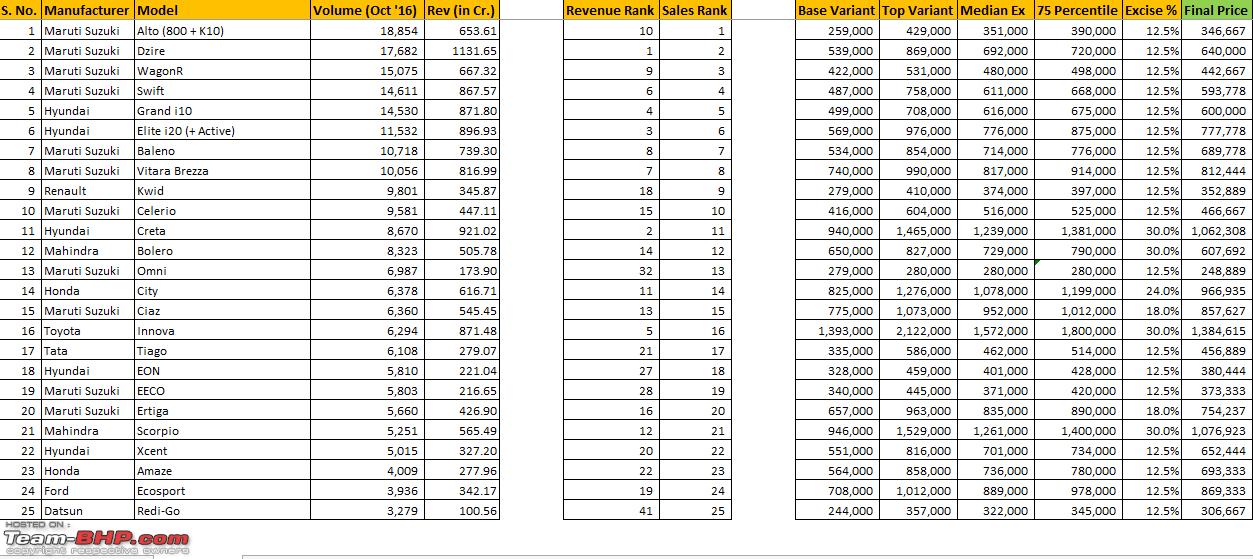
Top 25 Cars based on Revenue (calculated based on 75th Percentile of the Avg. Ex-Showroom Price, with Excise Duty % calculation included): 
1. This time Innova loses the top spot to Dzire and Creta falls to 5th place.
2. Maruti Suzuki dominates the Revenue rank too (like the Volume rank) with 6 places in the Top-10.
3. Hyundai has 3 cars in Top-10 and Toyota has Innova in 2nd spot.
4. Only Kwid moved out of Top-10 of the Volume ranking, replaced by the Innova.
5. Based on Top-25 Volume ranking, Omni, Eon, Indica and Amaze are moved out of Top-25 while XUV500, TUV300, BR-V and S-Cross have moved in to Top-25 Revenue ranking.
6. Based on the revenue, Ciaz and City are almost close to each other.
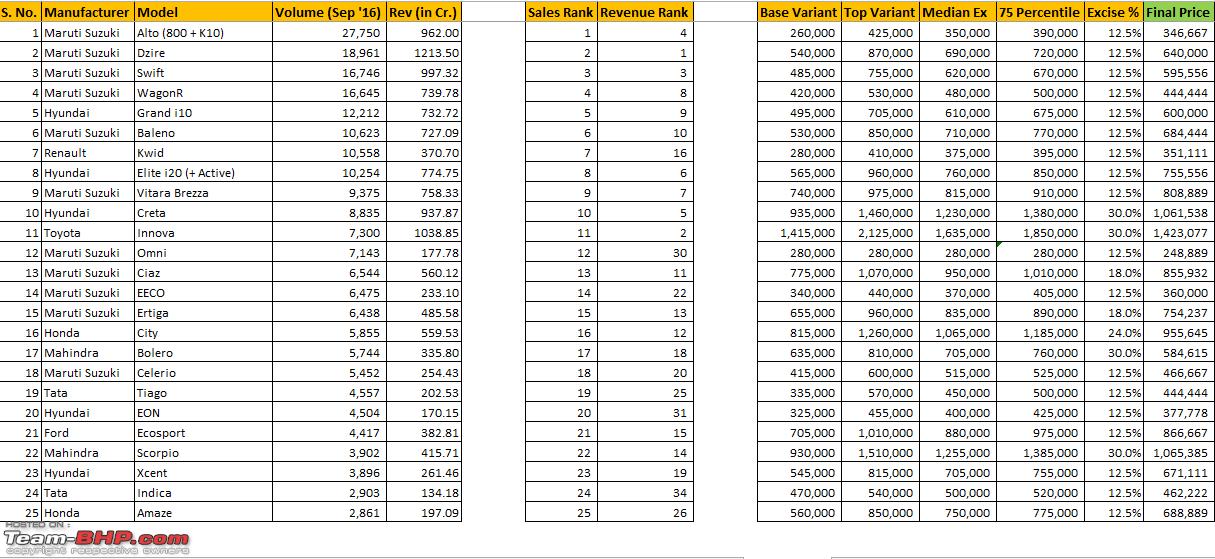
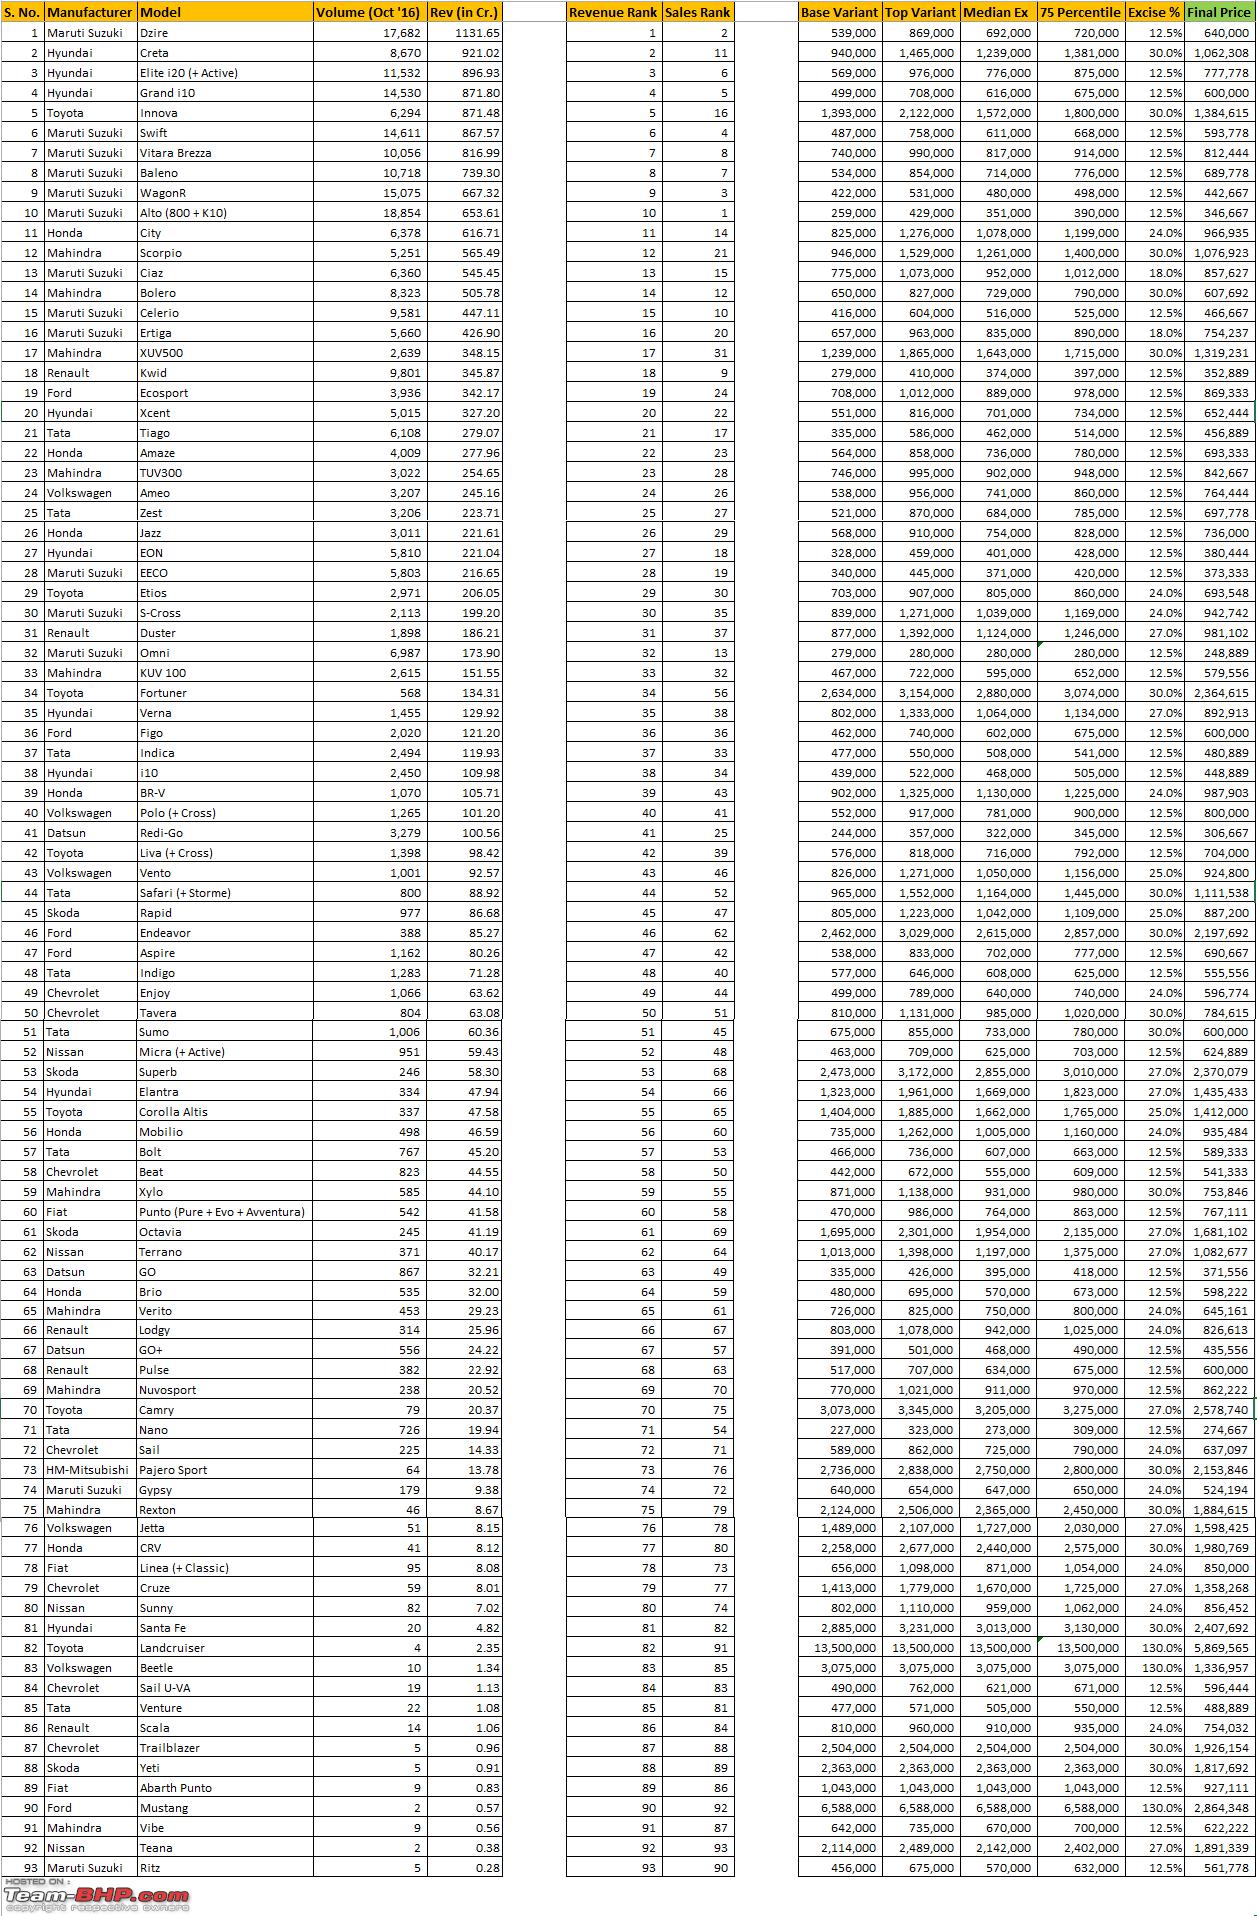
Top 25 Cars based on Sales Volume (and their corresponding Revenue rank):  OEM's Volume Market Share Vs Revenue Market Share:
1. Maruti Suzuki's market share in terms of Revenue is in the range of 42%, while it is almost 50% in terms of Volume. This is due to their volumes in entry level segment.
2. While considering the Revenue Market Share, Toyota has the major % increase when compared to the Volume Market Share - their % increase is in the range of 3.5-3.75%. This is due to their volumes in the higher segment cars like Innova, Corolla, Camry. Once the new Fortuner gets launched, this might even shoot up more.
3. Renault, Tata & Datsun are the manufacturers other than Maruti to see a fall in terms of Revenue Market Share compared to the Volume Market Share - as expected.
P.S.: Please note the revenues for the 3 Germans, JLR, Volvo, Porsche and other Luxury car makers are not included, who may have more revenue market share when compared to their minimal volume market share. For example, Mercedes Benz's revenue might be close to VW's revenue or may be more than that and this might have some impact in the actual revenue calculations. But, we do not have the individual numbers of the Luxury cars to do the calculation.
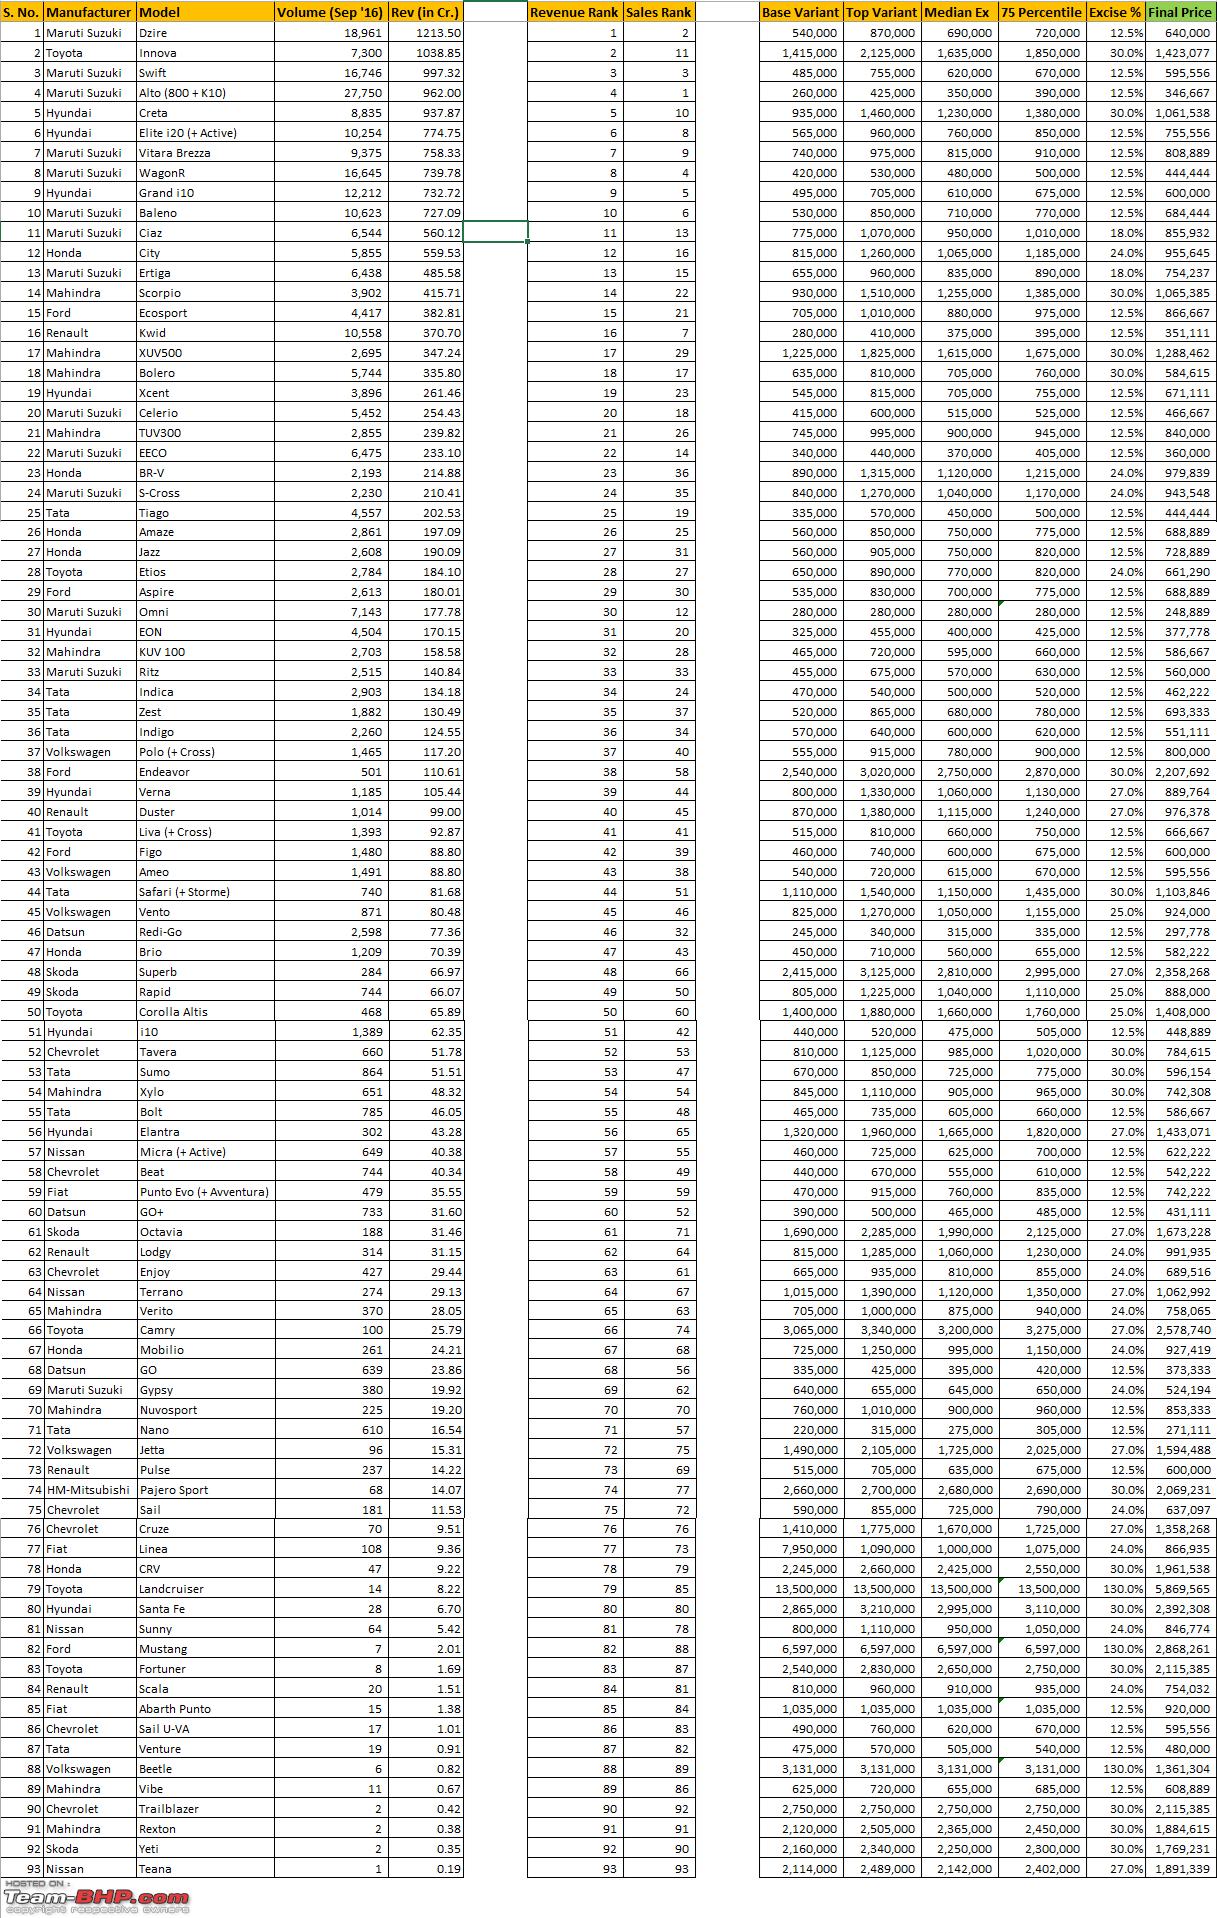
Full Chart for your perusal: 
Thanks for sharing this awesome post, Jpcoolguy! Moving your post to an independent thread. Will be added to the homepage tomorrow :thumbs up.
Good and interesting post. I believe these are approximations of gross revenue by model. I don't know if it is possible to know the net revenue per unit that a company earns, i.e., cost of production - the price to the dealer.
@jpcoolguy: Amazing analysis. Well deserved 5-star thread.
The premiumization attempted by Maruti can be clearly seen from the figures.
In August, they had 38.86% revenue market share by garnering 46.91% sales market share. (Crudely calculating, 38.86/46.91 to determine the ratio of value derived per unit of sale).
In September, riding on 42% revenue market share by capturing 49.5% sales market share, they boosted their top-line tremendously by launching and keeping the focus on premium products.
With this analysis, potential car dealers can determine which company's dealership to take.
Had I had the money, I would've gone for Toyota/Hyundai for sheer benefits earned on direct sales (with minimum manpower to attend to the low volumes) and Maruti/Hyundai for their servicing revenue.
Quote:
Originally Posted by turbospooler
(Post 4072643)
@jpcoolguy: Amazing analysis. Well deserved 5-star thread.
Had I had the money, I would've gone for Toyota/Hyundai for sheer benefits earned on direct sales (with minimum manpower to attend to the low volumes) and Maruti/Hyundai for their servicing revenue.
|
You put it better what I intended to in my earlier post. The slight disadvantage of this is that a drop in volumes would have more impact on the overall revenues.
That is a very interesting data, Innova at No.2 spot and how the Sales x Revenue can change for similar models.
Similarly the profitability model could also shuffle the ranks hugely, where premium mass models could easily be listed on Top 10.
The data for full year will be hugely appreciated.
Quote:
Originally Posted by vamsi.kona
(Post 4072577)
Good and interesting post. I believe these are approximations of gross revenue by model. I don't know if it is possible to know the net revenue per unit that a company earns, i.e., cost of production - the price to the dealer.
|
Yes, these are approx. values as you rightly said. There is no way to get the exact revenue per model/unit unless the Manufacturers disclose these data in public domain. This exercise is to find out which models are more profitable to the manufacturers (with some approximations) and was mainly prompted by the Innova Crysta's sales success, even after pricing it sky high.
Quote:
Originally Posted by turbospooler
(Post 4072643)
@jpcoolguy: Amazing analysis. Well deserved 5-star thread.
The premiumization attempted by Maruti can be clearly seen from the figures.
In August, they had 38.86% revenue market share by garnering 46.91% sales market share. (Crudely calculating, 38.86/46.91 to determine the ratio of value derived per unit of sale).
In September, riding on 42% revenue market share by capturing 49.5% sales market share, they boosted their top-line tremendously by launching and keeping the focus on premium products.
With this analysis, potential car dealers can determine which company's dealership to take.
Had I had the money, I would've gone for Toyota/Hyundai for sheer benefits earned on direct sales (with minimum manpower to attend to the low volumes) and Maruti/Hyundai for their servicing revenue.
|
Rightly said. Toyota is the only company whose difference between Revenue Share and Volume Share is more than 3% and this is without the new Fortuner's numbers. For Aug '16, it was more than 4% and I am pretty sure that with the launch of new Fortuner, this difference might go above 5%. None of the other manufacturers have even more than 2%, the closest being M&M and Hyundai with 1.98% and 1.88%.
This also explains why Toyota is least bothered about the entry level segments when they can fetch more money per car with Innova/Fortuner/Corolla/Camry.
Revenue Calculation data for last month sales - Oct '16.
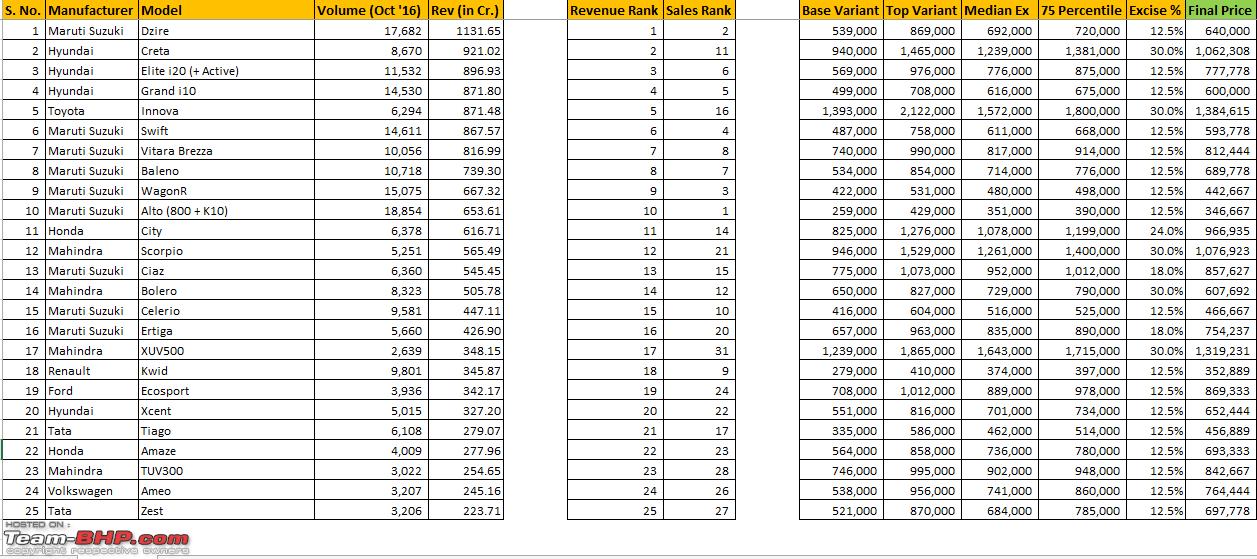
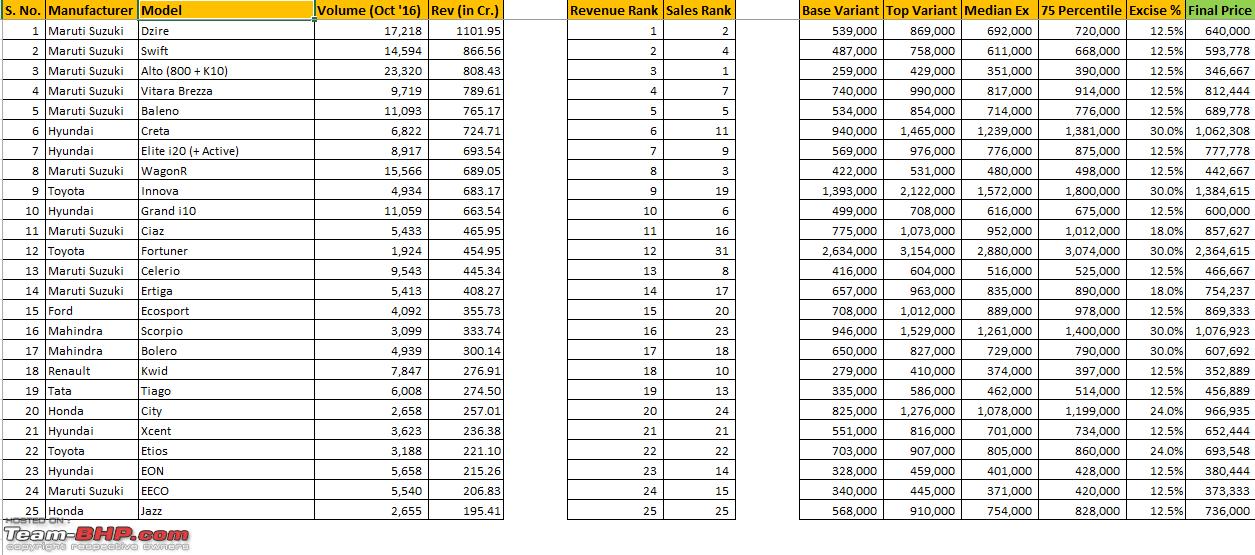
Top 25 Cars based on Revenue (calculated based on 75th Percentile of the Avg. Ex-Showroom Price, with Excise Duty % calculation included): 
1. Dzire retains its top spot but loses about 100 Cr.
2. This time around Creta and Innova swapped places - Creta in 2nd and Innova in 5th position.
3. Surprisingly, there are 3 entries in Top 5 from Hyundai, with i20 and i10 in 3rd and 4th spot respectively.
4. Swift comes in at 6th position, but do note that the cars from 3rd - 6th position are stacked very closely in terms of revenue and the positions may be interchanged based on the variants and fuel type being sold for a particular model. This exercise is just to approximate a position and should be taken at face value.
5. Brezza, Baleno, Wagon-R and Alto - all from Maruti Suzuki rounded off the Top 10 positions.
6. This time City clearly leads over Ciaz in terms of revenue, btw, Scorpio was managed to squeeze in between these two.
7. Omni (13 / 32), Eon (18 / 27), Eeco (19 / 28), and Redi-Go (25 / 41) from the Top-25 based on sales volume have moved out of the Top-25 chart based on sales revenue. They are replaced by XUV500 (31 / 17), TUV300 (28 / 23), Ameo (26 / 24) and Zest (27 / 25) - note that the first value within brackets denotes the Volume rank and the second value denotes the corresponding Revenue rank.
8. Compared to the last month's (Sep '16) Top-25 revenue ranking, Eeco (28 / 22), BR-V (39 / 23) and S-Cross (30 / 24) and they are replaced by Amaze (22 / 26), Ameo (24 / 43) and Zest (25 / 35) - note that the first value within brackets denotes Oct '16 Revenue rank and the second value denotes the Sep '16 rank.
Top 25 Cars based on Sales Volume (and their corresponding Revenue rank):  OEM's Volume Market Share Vs Revenue Market Share:
1. Maruti Suzuki's revenue market share is almost 7% lesser than their volume market share which is in line with the expected trend, because of their huge volumes in small car segment. But their revenue shrunk by more than 500 Cr. this month which is more than the total revenue of Volkswagen.
2. As expected, Toyota's revenue market share jumped by more than 3.3% compared to their volume market share due to their volumes in Innova, Fortuner, Corolla, Camry.
3. M&M is the other OEM whose revenue market share increased by over 2% followed by Honda's 1.5%. But this time around Hyundai's difference shrunk due to the increase in volume of Eon which leads to lower revenue.
4. Renault, Tata & Datsun are the manufacturers other than Maruti to see a fall in terms of Revenue Market Share compared to the Volume Market Share - as expected.
P.S.: Please note the revenues for the 3 Germans, JLR, Volvo, Porsche and other Luxury car makers are not included, who may have more revenue market share when compared to their minimal volume market share. For example, Mercedes Benz's revenue might be close to VW's revenue or may be more than that and this might have some impact in the actual revenue calculations. But, we do not have the individual numbers of the Luxury cars to do the calculation.
Full Chart for your perusal: 
Revenue Calculation data for last month sales - Nov '16.
Top 25 Cars based on Revenue (calculated based on 75th Percentile of the Avg. Ex-Showroom Price, with Excise Duty % calculation included): 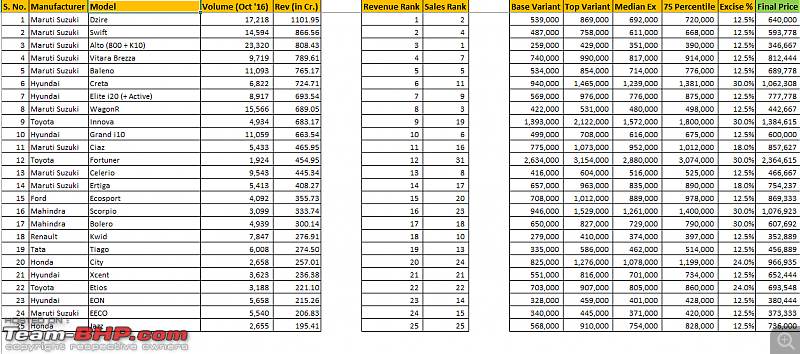
1. Dzire continues to hold the top spot, but major change is in the Top-5 spots which have all been occupied by Maruti Suzuki. Swift, Alto, Brezza and Baleno are in the ranks 2-5 respectively. Maruti have one more car - Wagon-R in the 8th position thus occupying 6 positions in the Top-10.
2. Hyundai again has 3 cars in Top-10 but slipped in the rankings and at the bottom of the table. Creta at 6th, i20 at 7th and i10 rounds of the tenth position.
3. The only other manufacturer in the Top-10 is the Toyota Innova sitting at 9th position, what a fall it has been, considering that Innova was at 2nd position during Sep '16.
4. Unsurprisingly Fortuner is just outside of Top-10 at 12th position (Ciaz is at 11th), but it is the one which have major jump in the Revenue rank compared to its Sales rank, which is 31.
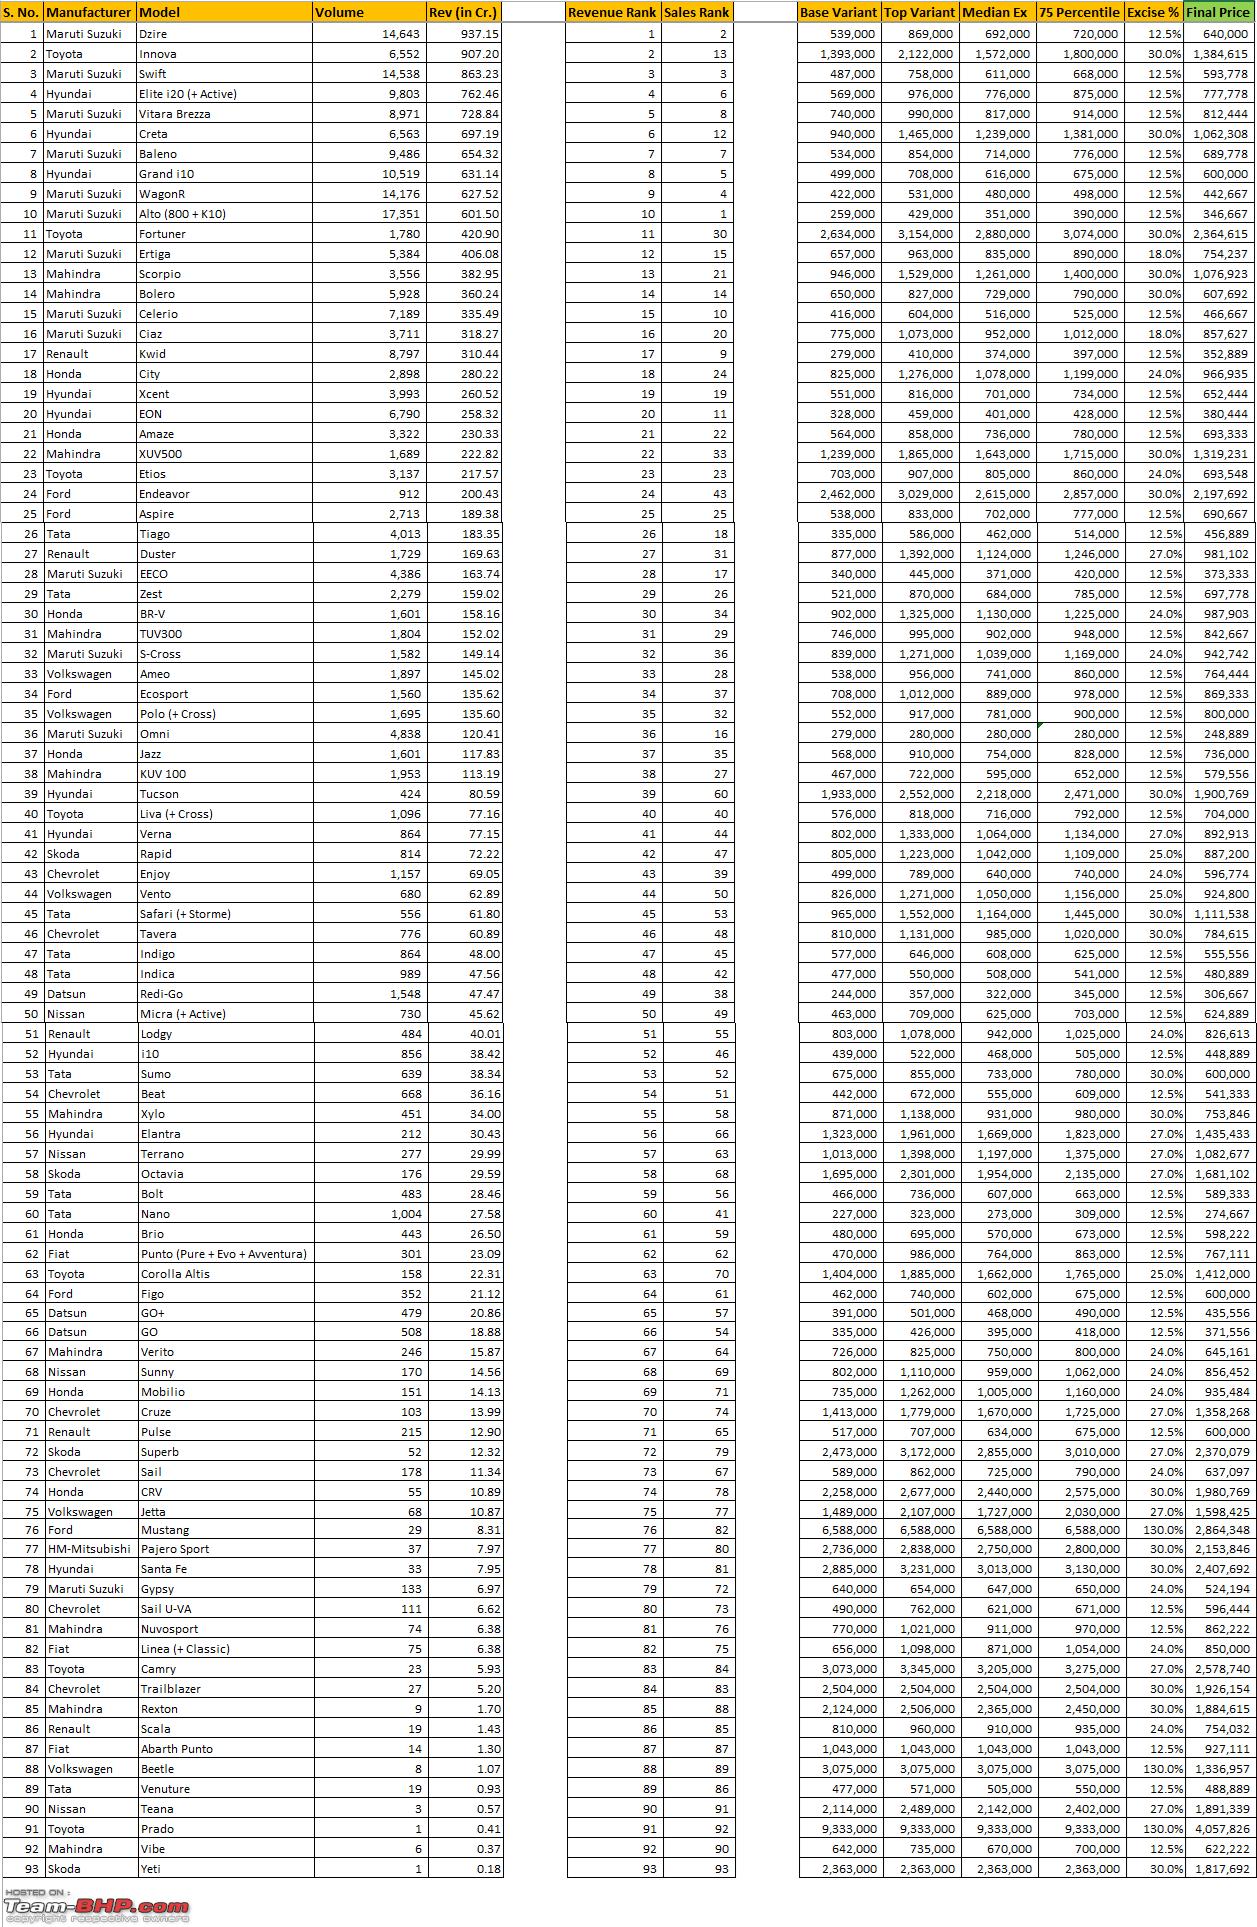
5. Maruti is on a roll this month, all the cars from Maruti Suzuki stable, except S-Cross (at 26), Omni (at 28) and Gypsy (at 77), present in the Top-25 positions of the Revenue rankings.
6. Ecosport is the highest ranking (at 15) car for Ford, Scorpio (at 16) for M&M, Kwid (at 18) for Renault, Tiago (at 19) for Tata, City (at 20) for Honda, Polo (at 30) for VW, Redi-Go (at 41) for Datsun, Rapid (at 42) for Skoda, Enjoy (at 44) for Chevrolet, Micra (at 54) for Nissan, Punto (at 64) for Fiat.
7. Interesting, this time only Omni (from 12 to 28) from the Top-25 based on sales volume have moved out of the Top-25 chart based on sales revenue, which is being replaced by Fortuner whose Sales rank was 31, but moved to 12th in Revenue rank.
8. There have been lot of changes in Top-25 positions when compared to last month (Oct '16). XUV 500 (29 / 17), Amaze (31 / 22), TUV 300 (36 / 23), Ameo (32 / 24) and Zest (27 / 25) have been moved out of Top-25 and they are replaced by Fortuner (12 / 34), Etios (22 / 29), Eon (23 / 27), Eeco (24 / 28) and Jazz (25 / 26) - note that the first value within brackets denotes Nov '16 Revenue rank and the second value denotes the Oct '16 rank.
Top 25 Cars based on Sales Volume (and their corresponding Revenue rank):  OEM's Volume Market Share Vs Revenue Market Share:
1. Maruti Suzuki's revenue market share is 8% lesser than their volume market share, but they have increased their revenue share to a whopping 44.75% share compared to 37.63% last month.
2. As expected, Toyota's revenue market share jumped by 4.8% compared to their volume market share, due to their HUGE volumes in Fortuner and Innova.
3. M&M lost their 3rd place to Toyota in terms of Revenue (while they have lost the 3rd place to Tata in terms of Volume).
4. Renault, Tata & Datsun are the manufacturers other than Maruti to see a fall in terms of Revenue Market Share compared to the Volume Market Share - as expected, due to their volume in small cars.
5. Except Maruti, Toyota, Ford and Chevrolet, all the other manufacturers has seen a decrease in their Revenue Market Share, but in terms of absolute revenue Chevrolet lost approx. 16 Cr. compared to last month.
P.S.: Please note the revenues for the 3 Germans, JLR, Volvo, Porsche and other Luxury car makers are not included, who may have more revenue market share when compared to their minimal volume market share. For example, Mercedes Benz's revenue might be close to VW's revenue or may be more than that and this might have some impact in the actual revenue calculations. But, we do not have the individual numbers of the Luxury cars to do the calculation.
Full Chart for your perusal: 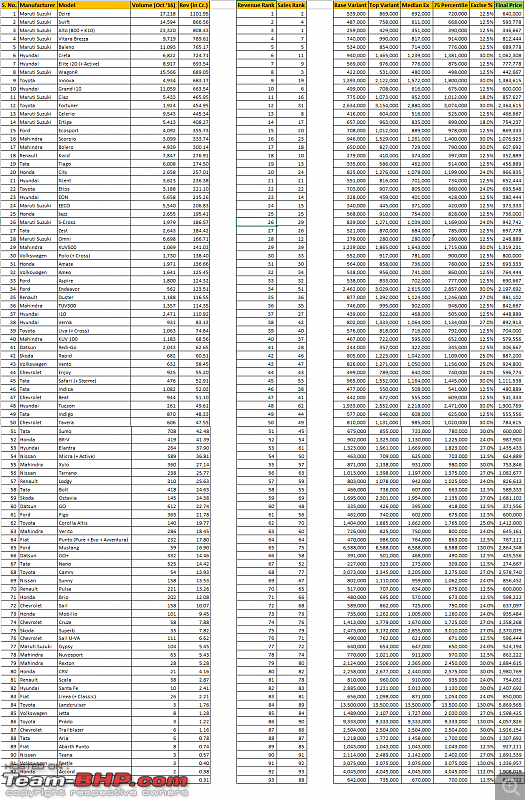
If we are relating this to a dealers profits there are one or two other variables to add.
Floor planning: dealers also borrow money to buy the car from the mfr. The longer it sits in the showroom the more interest he has to pay.
Holdback: mfrs. keep a small 1-2% of the MRP with themselves until the car is actually sold. This is to cover the dealers finance cost. It also adds to profit if he gets rid of the car quickly.
Factory rebate and dealers rebate: customers usually bargain on the dealers rebate. And they usually get it easily. Ask about the factory rebate also.
Documentation fees: excellent and easy profits for the dealer. If the RTO registration and tax cost is Rs. 10 you pay 20-30 rupees.
Finance fees: company finance or dealer arranged finance gets them straight up commissions. Interest component also has dealer margin added to it.
Insurance: easy money. Big money.
Extras: anti rust coatings, security features and accessories give them eye watering profits.
Used cars: this is known. Your used cars or traded in vehicles give them maximum profits.
Revenue Calculation data for last month sales - Dec '16.
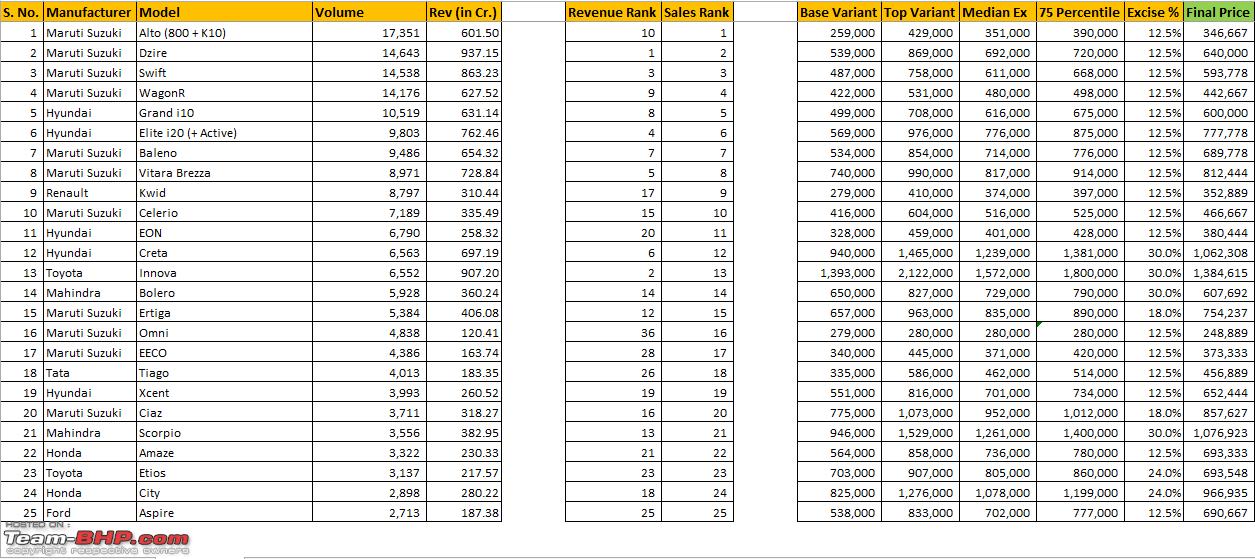
Top 25 Cars based on Revenue (calculated based on 75th Percentile of the Avg. Ex-Showroom Price, with Excise Duty % calculation included): 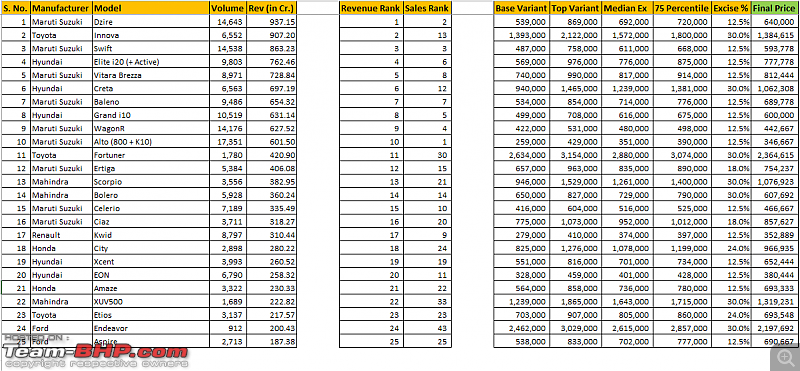
1. Dzire holds on to the top spot but had lost a lot of value, going below 1000 Cr after a long time. There are no cars whose revenue exceeds 1000 Cr. this month.
2. Innova back to the 2nd spot and almost closed the gap on Dzire - the gap is only 30 Cr. wide.
3. Maruti Suzuki have 3 cars in Top-5 - Swift in 3rd and Brezza in 5th and 3 more in Top-10 - Baleno in 7th, Wagon-R in 9th and Alto completes the Top-10.
4. Hyundai again have 3 cars in Top-10 - i20 in 4th, Creta in 6th and Grand i10 in 8th.
5. Fortuner climbed to 11th position, in terms of Revenue, from 30th, in terms of volume. Toyota must be laughing their way to banks with Innova and Fortuner.
6. In the Top-25 positions, Maruti Suzuki has 9 cars, followed by Hyundai with 5 cars. Mahindra and Toyota have 3 each, Honda and Ford have 2 each and Renault claims the remaining 1 spot - Tata don't have any, Tiago missed it by a whisker and comes at 26th place.
7. Endeavor enters Top-25 for the first time.
8. Scorpio is the highest ranking (at 13) car for M&M, Kwid (at 17) for Renault, City (at 18) for Honda, Endeavor (at 24) for Ford, Tiago (at 26) for Tata, Ameo (at 33) for VW, Rapid (at 42) for Skoda, Enjoy (at 43) for Chevrolet, Redi-Go (at 49) for Datsun, Micra (at 50) for Nissan, Punto (at 62) for Fiat.
9. Omni (16 / 36), Eeco (17 / 28) and Tiago (18 / 26) from the Top-25 based on sales volume have moved out of the Top-25 chart based on sales revenue. They are replaced by Fortuner (30 / 11), XUV500 (33 / 22), TUV300 (28 / 23) and Endeavor (43 / 24) - note that the first value within brackets denotes the Volume rank and the second value denotes the corresponding Revenue rank.
10. Compared to the last month's (Nov '16) Top-25 revenue ranking, Ecosport (34 / 15), Tiago (26 / 19), Eeco (28 / 24), Jazz (37 / 25) have moved out and they are replaced by Amaze (21 / 31), XUV500 (22 / 29), Endeavor (24 / 34) and Aspire (25 / 33) - note that the first value within brackets denotes Dec '16 Revenue rank and the second value denotes the Nov '16 Revenue rank.
Top 25 Cars based on Sales Volume (and their corresponding Revenue rank):  OEM's Volume Market Share Vs Revenue Market Share:
1. As always, Maruti Suzuki's revenue market share is 8% lesser than their volume market share. Renault, Tata & Datsun are the manufacturers other than Maruti to see a fall in terms of Revenue Market Share compared to the Volume Market Share - as expected, due to their volume in small cars.
2. As expected, Toyota's revenue market share jumped by more than 5% compared to their volume market share, due to their HUGE volumes in Innova and Fortuner.
3. Toyota and M&M, Honda and Tata have reversed their positions in Revenue charts. Interestingly, Ford with less than half of volume as Renault generates more revenue than them - Endeavor and Kwid effect.
P.S.: Please note the revenues for the 3 Germans, JLR, Volvo, Porsche and other Luxury car makers are not included, who may have more revenue market share when compared to their minimal volume market share. For example, Mercedes Benz's revenue might be close to VW's revenue or may be more than that and this might have some impact in the actual revenue calculations. But, we do not have the individual numbers of the Luxury cars to do the calculation.
Full Chart for your perusal: 
Revenue Calculation data for last month sales - Jul '17.
(I was not able to find time earlier since I was busy with my work for past 8 months).
This month there was a lot of urge to do the revenue calculation since the tax structure on cars have been changed with the introduction of GST and I have tried to incorporate them in last month's revenue calculation.
The new calculation is based on the fixed % of GST (28%) + the additional cess on different segments of cars and they are defined as below:
- Base GST : 28%
- < 4m passenger vehicles (petrol, CNG, Ethanol, Methanol) - 1%
- < 4m passenger vehicles (diesel, Ethanol, Methanol) - 3%
- > 4m passenger vehicles (Petrol, Diesel, CNG, Ethanol, methanol, hybrid electric and fuel cell) - 15%
For all the sub-4m cars with only Petrol variants, I have taken the additional cess at 1% (eg. Alto, Kwid, Nano, etc), so the effective tax - 29%
For all the sub-4m cars with both Petrol and Diesel variants, I have taken the additional cess at 2%, average of 1 and 3 (eg. Tiago, Grand i10, Swift, Baleno, etc), so the effective tax - 30%
For all the sub-4m cars with only Diesel variants, I have taken the additional cess at 3% (eg. Brezza, TUV300, etc), so the effective tax - 31%
For all the cars greater than 4m, I have taken the additional cess at 15%, so the effective tax - 43%
But, take these numbers with a pinch of salt as these are mostly approximations since we don't know the exact number of Petrol and Diesel variants sold and cost of other factors involved in the manufacturing process. These numbers are just to give an idea on how much revenue (not profit) approx. each OEMs are generating on a monthly basis.
Now, moving on to the actual charts with revenue calculation:
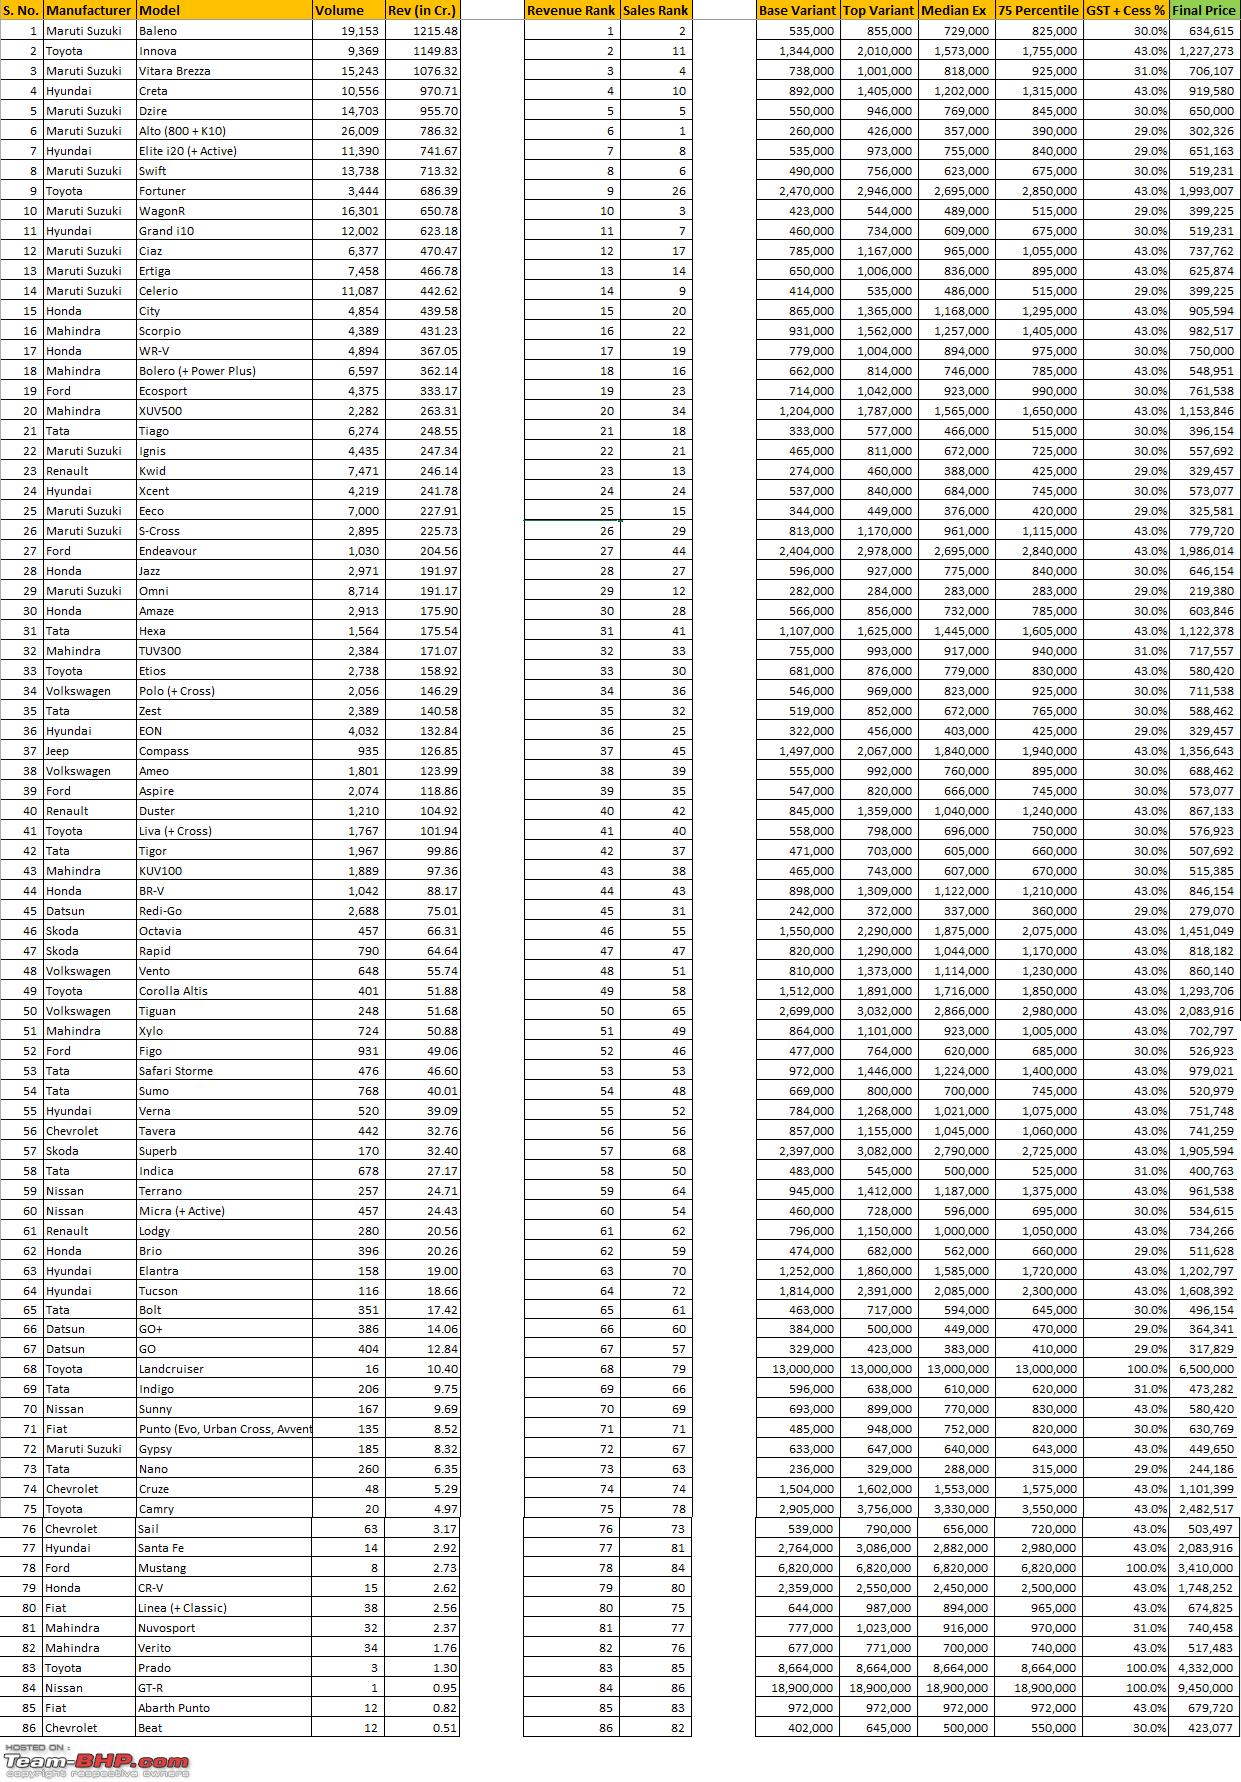
Top 25 Cars based on Revenue (calculated based on 75th Percentile of the Avg. Ex-Showroom Price):

1. Baleno grabs the top spot with revenue of well over 1000 Cr. as expected due to increase in sales volume recently.
2. Innova as always in the podium, this time in 2nd place and Brezza sits at 3rd position with the new increased sales volume recently. And only Top 3 cars are the ones to breach the 1000 Cr. mark.
3. Then comes Hyundai's cash cow, the Creta marginally less than 1000 Cr. and followed by Dzire, the erstwhile leader in revenue calculations.
4. Maruti Suzuki has 6 cars in the Top 10 and Hyundai and Toyota has 2 each - Toyota particularly impressive with 2 overpriced vehicles accepted universally by the customers.
5. Fortuner storms into Top 10 in Revenue chart, whereas it lies just outside of Top 25 (at 26th position) in the Volume chart - goes to show how much Toyota must be earning from this full blown SUV.
6. In the Top 25 positions, Maruti Suzuki has 11 cars, followed by Hyundai which has 4 cars, M&M has 3 cars, Toyota and Honda has 2 each, Ford, Tata and Renault sharing the remaining 3 slots.
7. City is the highest ranking (at 15) car for Honda, Scorpio (at 16) for M&M, Ecosport (at 19) for Ford, Tiago (at 21) for Tata, Kwid (at 23) for Renault, Polo (at 34) for VW, Compass (at 37) for Jeep, Redi-Go (at 45) for Datsun, Octavia (at 46) for Skoda, Tavera (at 56) for Chevrolet, Terrano (at 59) for Nissan, Punto (at 71) for Fiat.
8. Omni (12 / 29) and Eon (25 / 36) from the Top-25 based on sales volume have moved out of the Top-25 chart based on sales revenue. They are replaced by Fortuner (26 / 9) and XUV500 (34 / 20) - note that the first value within brackets denotes the Volume rank and the second value denotes the corresponding Revenue rank.
Top 25 Cars based on Sales Volume (and their corresponding Revenue rank):  OEM's Volume Market Share Vs Revenue Market Share:
1. As always, Maruti Suzuki's revenue market share is approx. 9% lesser than their volume market share. Renault, Tata & Datsun are the manufacturers other than Maruti to see a fall in terms of Revenue Market Share compared to the Volume Market Share - as expected, due to their larger volume in small cars.
2. As expected, Toyota's revenue market share jumped close to 6% compared to their volume market share, due to their VERY HUGE volumes in Innova and Fortuner.
3. Jeep has a good start and hope they are able to maintain and improve their numbers which will be good for the market as a whole.
P.S.: Please note the revenues for the 3 Germans, JLR, Volvo, Porsche and other Luxury car makers are not included, who may have more revenue market share when compared to their minimal volume market share. For example, Mercedes Benz's revenue might be close to VW's revenue or may be more than that and this might have some impact in the actual revenue calculations. But, we do not have the individual numbers of the Luxury cars to do the calculation.
Full Chart for your perusal: 
Revenue Calculation data for last month sales - Aug '17.
Top 25 Cars based on Revenue (calculated based on 75th Percentile of the Avg. Ex-Showroom Price): 
1. Dzire with that humongous 31K units sold, is in the first position and has crossed the 2000 Cr barrier.
2. Maruti Suzuki has able to capture the Top 3 positions for the first time in the revenue chart, since the Innova has moved down to 6th position for the first time.
3. Hyundai fills in nicely with Creta and i20 at 4/5 positions and the Grand i10 in the 9th position.
4. Maruti Suzuki has 6 cars in Top 10, Hyundai has 3 and Toyota has Innova. Compass has broken into Top 25 in its 2nd month of installment.
5. In Top 25 positions, Maruti Suzuki has 9 cars, followed by Hyundai with 4 cars, M&M with 3 cars, Toyota, Honda and Ford with 3 each and Tata, Jeep and Renault sharing the remaining 3 positions.
6. City is the highest ranking (at 11) car for Honda, Scorpio (at 13) for M&M, Ecosport (at 21) for Ford, Tiago (at 22) for Tata, Compass (at 23) for Jeep, Kwid (at 24) for Renault, Polo (at 34) for VW, Rapid (at 42) for Skoda, Redi-Go (at 44) for Datsun, Terrano (at 59) for Nissan, Punto (at 67) for Fiat and Cruze (at 81) for Chevrolet.
7. Ignis (25 / 26), Eeco (16 / 27), Omni (12 / 31) and Eon (24 / 33) from the Top-25 based on sales volume have moved out of the Top-25 chart based on sales revenue. They are replaced by Fortuner (31 / 14), XUV500 (27 / 19), Compass (34 / 23) and Endeavor (44 / 25) - note that the first value within brackets denotes the Volume rank and the second value denotes the corresponding Revenue rank.
8. Compared to the last month's (Jul '17) Top-25 revenue ranking, Ignis (22 / 26), Xcent (24 / 28) and Eeco (25 / 27) have moved out and they are replaced by Verna (15 / 55), Compass (23 / 37) and Endeavor (25 / 27) - note that the first value within brackets denotes Aug '17 Revenue rank and the second value denotes the Jul '17 Revenue rank.
Top 25 Cars based on Sales Volume (and their corresponding Revenue rank):  OEM's Volume Market Share Vs Revenue Market Share:
1. As always, Maruti Suzuki's revenue market share is approx. 8.7% lesser than their volume market share. Renault, Tata & Datsun are the manufacturers other than Maruti to see a fall in terms of Revenue Market Share compared to the Volume Market Share - as expected, due to their larger volume in small cars.
2. As expected, Toyota's revenue market share jumped close to 4% compared to their volume market share, due to their huge volumes in Innova and Fortuner, but lesser than last month.
3. Renault-Nissan-Datsun alliance has bigger market share in terms of Volume (4.95%), but when it comes to Revenue they have only 3.26% (lesser by 1.7%, when compared to volume market share).
P.S.: Please note the revenues for the 3 Germans, JLR, Volvo, Porsche and other Luxury car makers are not included, who may have more revenue market share when compared to their minimal volume market share. For example, Mercedes Benz's revenue might be close to VW's revenue or may be more than that and this might have some impact in the actual revenue calculations. But, we do not have the individual numbers of the Luxury cars to do the calculation.
Full Chart for your perusal: 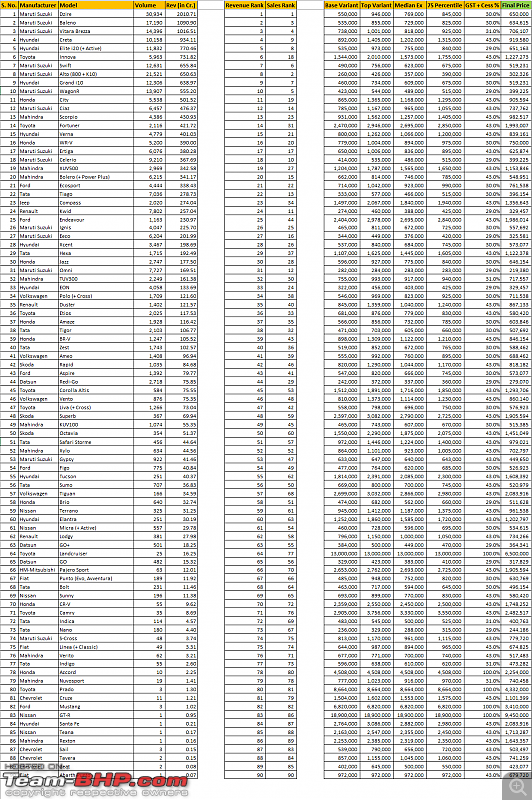
Revenue Calculation data for last month sales - Sep '17.
Since, there was a revision in GST rates for the cars, below is the basis of the new calculation.
The new calculation is based on the fixed % of GST (28%) + the additional cess on different segments of cars and they are defined as below:
- Base GST : 28%
- < 4m passenger vehicles (petrol, CNG, Ethanol, Methanol) - 1%
- < 4m passenger vehicles (diesel, Ethanol, Methanol) - 3%
- > 4m midsize Sedans (petrol, diesel, CNG, Ethanol, Methanol, Hybrid) - 17%
- > 4m Luxury Sedans (petrol, diesel, CNG, Ethanol, Methanol, Hybrid) - 20%
- > 4m SUVs (petrol, diesel, CNG, Ethanol, Methanol, Hybrid) - 22%
For all the sub-4m cars with only Petrol variants, I have taken the additional cess at 1% (eg. Alto, Kwid, Nano, etc), so the effective tax - 29%
For all the sub-4m cars with both Petrol and Diesel variants, I have taken the additional cess at 2%, average of 1 and 3 (eg. Tiago, Grand i10, Swift, Baleno, etc), so the effective tax - 30%
For all the sub-4m cars with only Diesel variants, I have taken the additional cess at 3% (eg. Brezza, TUV300, etc), so the effective tax - 31%
For all the sedans that falls under midsize sedans category, I have taken the additional cess at 17% (eg. City, Ciaz, Verna, Rapid, Corolla, Elantra, etc), so the effective tax - 45%
For all the SUVs greater than 4m, I have taken the additional cess at 22%, so the effective tax - 50%
But, take these numbers with a pinch of salt as these are mostly approximations since we don't know the exact number of Petrol and Diesel variants sold and cost of other factors involved in the manufacturing process. These numbers are just to give an idea on how much revenue (not profit) approx. each OEMs are generating on a monthly basis.
Now, moving on to the actual charts with revenue calculation:
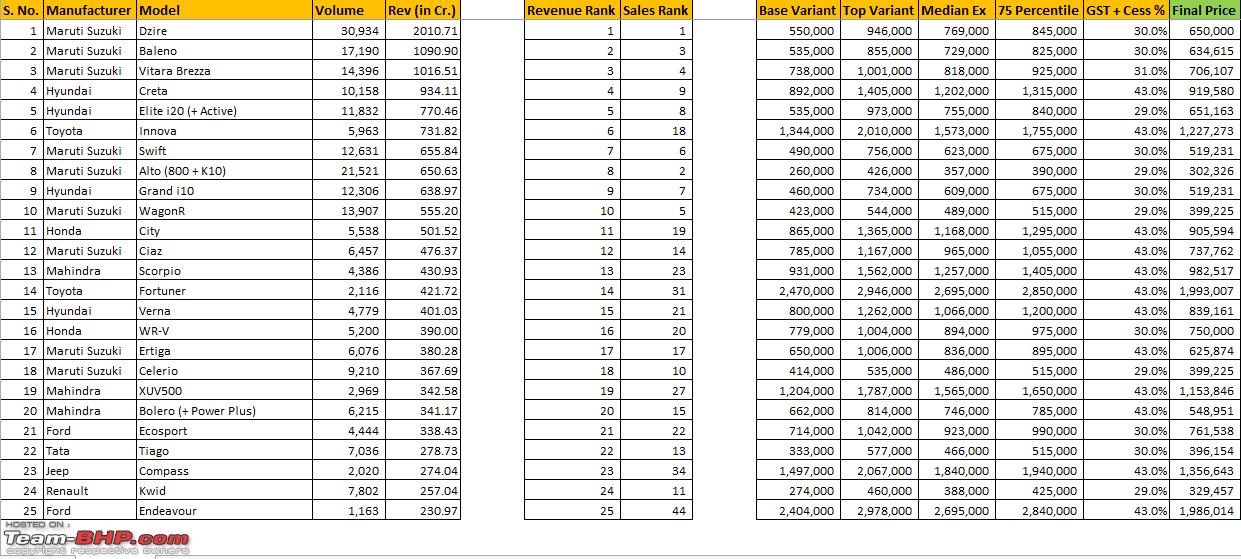
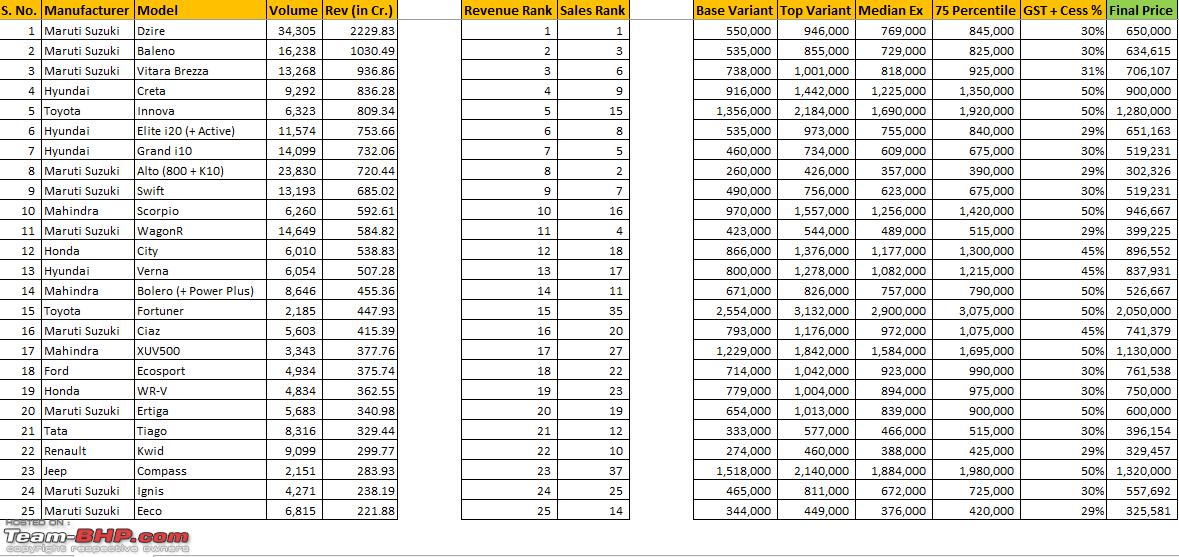
Top 25 Cars based on Revenue (calculated based on 75th Percentile of the Avg. Ex-Showroom Price): 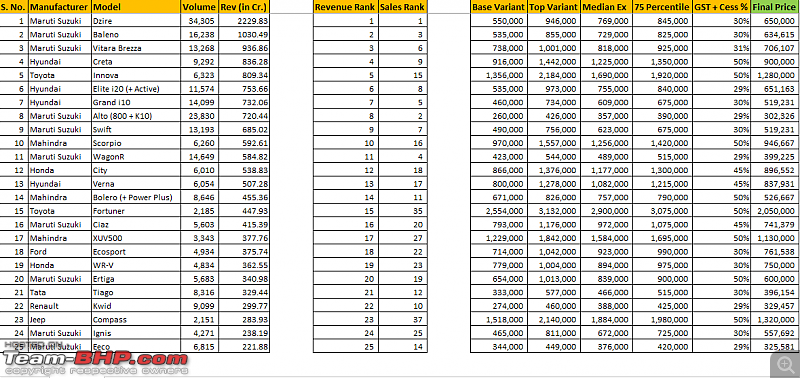
1. Dzire with its best ever month, is in the first position and has collected over 2000 Cr. revenue for the 2nd consecutive month.
2. Maruti Suzuki has kept the Top 3 positions again this month in the revenue chart, with Baleno and Brezza following the foot paths of Dzire.
3. Hyundai has its usual suspects, Creta, i20, Grand i10 at 4th, 6th and 7th positions respectively. Innova swaps place with i20, jumping from 6th to 5th position from last month figures.
4. Mahindra has able to break in to Top-10 in Revenue charts for the first time (since this exercise) with an extra-ordinary month for Scorpio, slotting it in the 10th position.
5. Maruti Suzuki has 5 cars in Top 10, Hyundai has 3, Toyota has Innova and M&M has Scorpio.
6. In Top 25 positions, Maruti Suzuki has 10 cars, followed by Hyundai with 4 cars, M&M with 3 cars, Toyota and Honda with 2 each and Ford, Tata, Jeep and Renault sharing the remaining 4 positions with 1 each.
7. City is the highest ranking (at 12) car for Honda, Ecosport (at 18) for Ford, Tiago (at 21) for Tata, Kwid (at 22) for Renault, Compass (at 23) for Jeep, Polo (at 32) for VW, Rapid (at 39) for Skoda, Redi-Go (at 45) for Datsun, Micra (at 53) for Nissan and Punto (at 70) for Fiat.
7. Omni (13 / 34), Eon (21 / 31) and Celerio (24 / 29) from the Top-25 based on sales volume have moved out of the Top-25 chart based on sales revenue. They are replaced by Fortuner (35 / 15), XUV500 (27 / 17) and Compass (37 / 23) - note that the first value within brackets denotes the Volume rank and the second value denotes the corresponding Revenue rank.
8. Compared to the last month's (Aug '17) Top-25 revenue ranking, Celerio (29 / 18), and Endeavor (43 / 25) have moved out and they are replaced by Ignis (24 / 26) and Eeco (25 / 27) - note that the first value within brackets denotes Sep '17 Revenue rank and the second value denotes the Aug '17 Revenue rank.
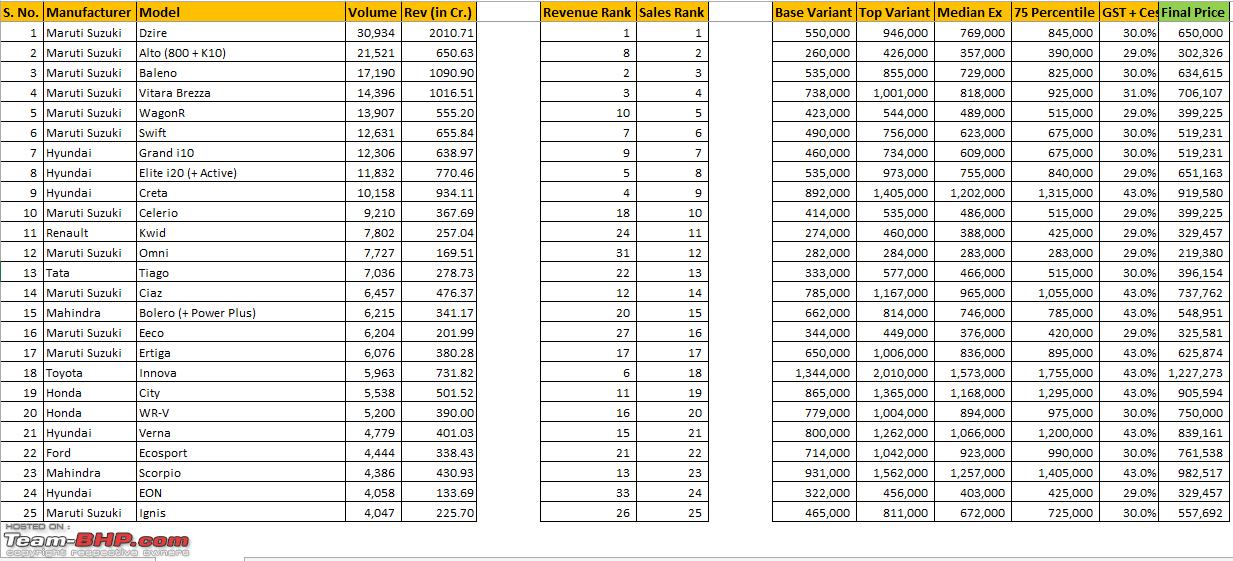
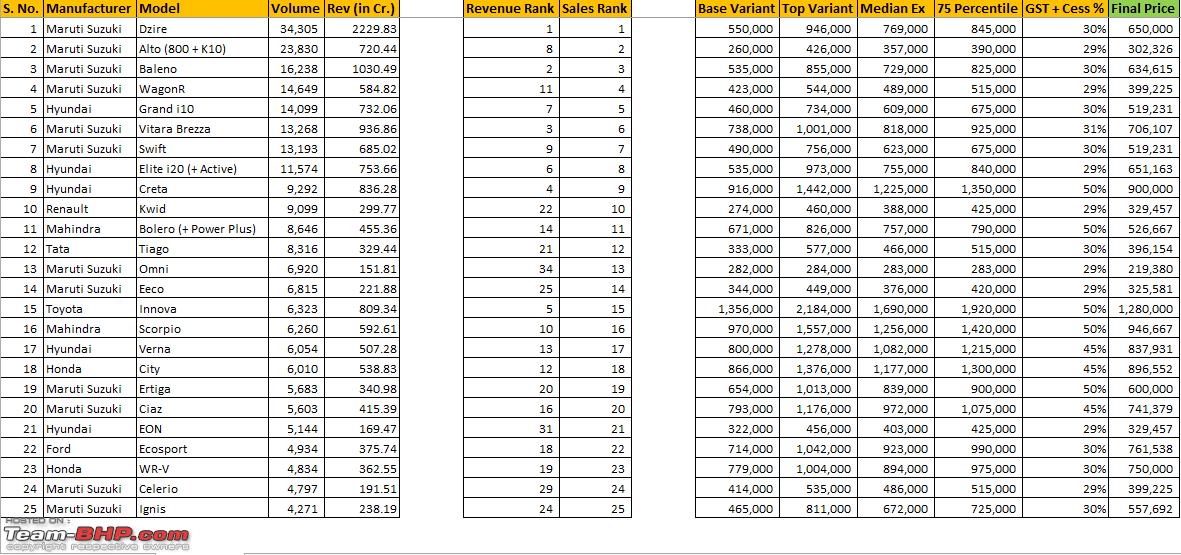
Top 25 Cars based on Sales Volume (and their corresponding Revenue rank):  OEM's Volume Market Share Vs Revenue Market Share:
1. As always, Maruti Suzuki's revenue market share is approx. 8% lesser than their volume market share. Renault, Tata & Datsun are the manufacturers other than Maruti to see a fall in terms of Revenue Market Share compared to the Volume Market Share - as expected, due to their larger volume in small cars.
2. As expected, Toyota's revenue market share jumped close to 4% compared to their volume market share, due to their huge volumes in Innova and Fortuner.
3. Renault-Nissan-Datsun alliance has bigger market share in terms of Volume (5.21%), but when it comes to Revenue they have only 3.36% (lesser by 1.85%, when compared to volume market share).
P.S.: Please note the revenues for the 3 Germans, JLR, Volvo, Porsche and other Luxury car makers are not included, who may have more revenue market share when compared to their minimal volume market share. For example, Mercedes Benz's revenue might be close to VW's revenue or may be more than that and this might have some impact in the actual revenue calculations. But, we do not have the individual numbers of the Luxury cars to do the calculation.
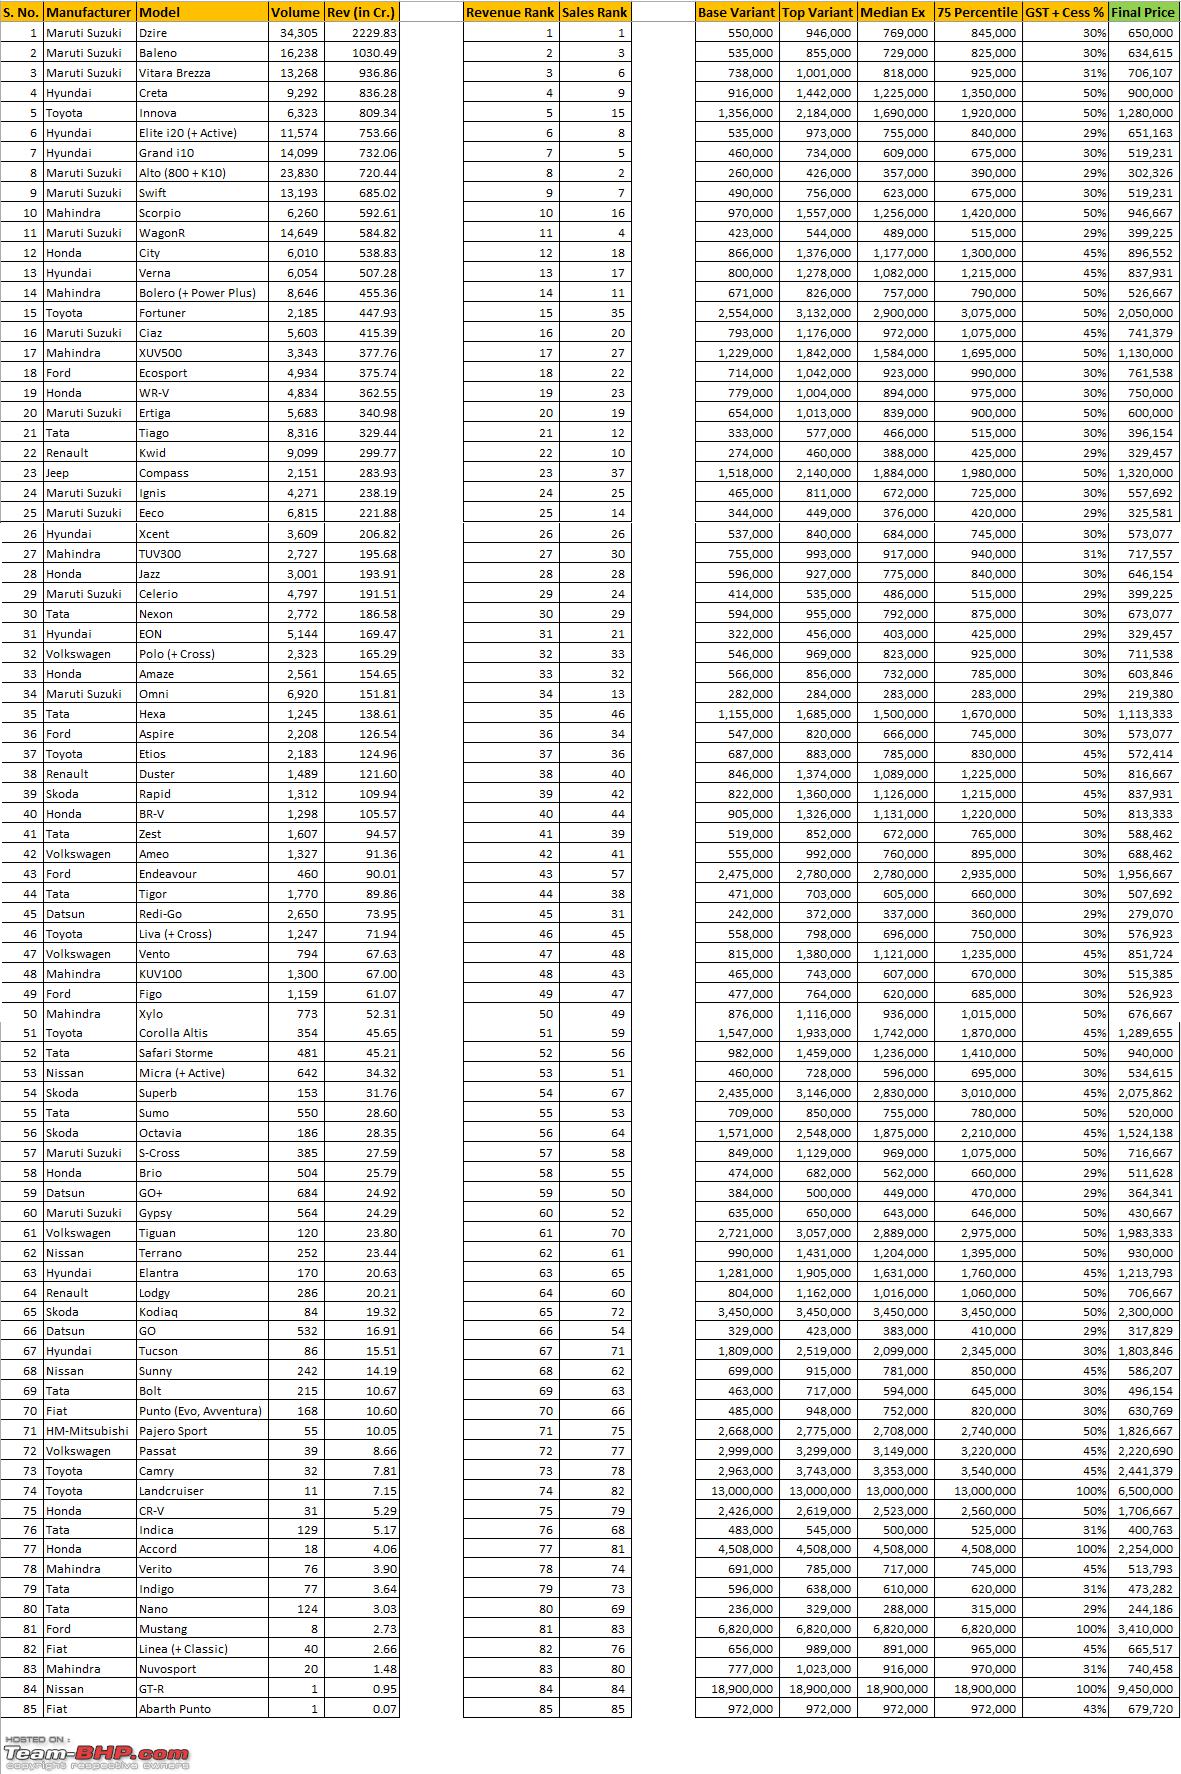
Full Chart for your perusal: 
Hi JpCoolGuy, it's awesome the way you keep putting this together month after month :thumbs up
That said, I do have a suggestion, it occurs to me that in the "OEM Volume Market Share Vs Revenue Market Share" table of statistics, for the last column, i.e. "Difference", it would be better if instead of a difference, it's expressed as a ratio.
I think TurboSpooler has alluded to the same in an earlier post.
~
| All times are GMT +5.5. The time now is 18:42. | |