Team-BHP > The Indian Car Scene
Register New Topics New Posts Top Thanked Team-BHP FAQ


Reply
  Search this Thread
64,694 views
Old 15th June 2017, 09:58   #16
Senior - BHPian
 
Latheesh's Avatar
 
Join Date: Dec 2007
Location: CNN/BLR
Posts: 4,241
Thanked: 10,067 Times
re: State-wise Car Sales in India : April 2016 to March 2017 (FY17)

Kerala numbers are worrying actually. State with just 2.7% of country's population is buying 7.5% of total cars sold.
Latheesh is offline  
Old 15th June 2017, 09:59   #17
Team-BHP Support
 
moralfibre's Avatar
 
Join Date: Dec 2004
Location: MH-12
Posts: 8,443
Thanked: 13,956 Times
re: State-wise Car Sales in India : April 2016 to March 2017 (FY17)

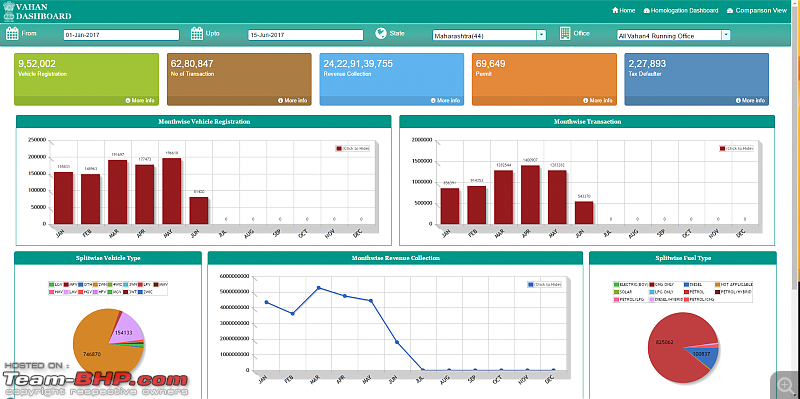
This data is now available in more granular detail on Parivahan dashboard. All state RTOs that have adopted Vahan 4 are auto populating this data in a very useful dashboard like this:


State-wise Car Sales in India : April 2016 to March 2017 (FY17)-dashboard.png

Last edited by Rehaan : 15th June 2017 at 17:26. Reason: Fixing url (switching anchor text & url) :)
moralfibre is offline   (5) Thanks
Old 28th November 2017, 20:18   #18
Distinguished - BHPian
 
Join Date: Dec 2010
Location: --
Posts: 23,403
Thanked: 67,767 Times
Re: State-wise Car Sales in India : April 2016 to March 2017 (FY17)

State-wise Sales April - Sept. 2017,

-Maharashtra alone contributes to ~12% of national volumes
-The Top 2 states in terms of PV sales belong from West Zone.

State-wise Car Sales in India : April 2016 to March 2017 (FY17)-23.jpg


Link
volkman10 is offline   (3) Thanks
Old 28th November 2017, 21:10   #19
Senior - BHPian
 
Arjun Reddy's Avatar
 
Join Date: Jun 2013
Location: Bangalore
Posts: 1,529
Thanked: 2,891 Times

Quote:
Originally Posted by volkman10 View Post
State-wise Sales April - Sept. 2017,

-Maharashtra alone contributes to ~12% of national volumes

No surprises in the chart. I probably expected Andhra Pradesh to do better numbers. Probably if you combine AP and Telangana, the numbers do add up.

Wonder how many of the 3500 cars registered in Pondicherry came from outside?

Thanks for sharing.
Arjun Reddy is offline  
Old 20th August 2018, 08:31   #20
Distinguished - BHPian
 
Join Date: Dec 2010
Location: --
Posts: 23,403
Thanked: 67,767 Times
Re: State-wise Car Sales in India : April 2016 to March 2017 (FY17)

State-wise Passenger Cars Sales Data for Apr’18-June’18 (Q1)

- From India's 33 states, Maharashtra alone contributes to ~10% of national volumes.

- East Zone has highest number of states (13), but volume contribution is the least in 4 Zones

-In terms of land area, Rajasthan stands No. 1 in India (source). However in terms of Passenger Vehicle (PV) sales, it Ranks 9th!

-In Q1 FY19, Mizoram has witnessed the highest YoY growth (70%) in India

State-wise Car Sales in India : April 2016 to March 2017 (FY17)-18.jpg

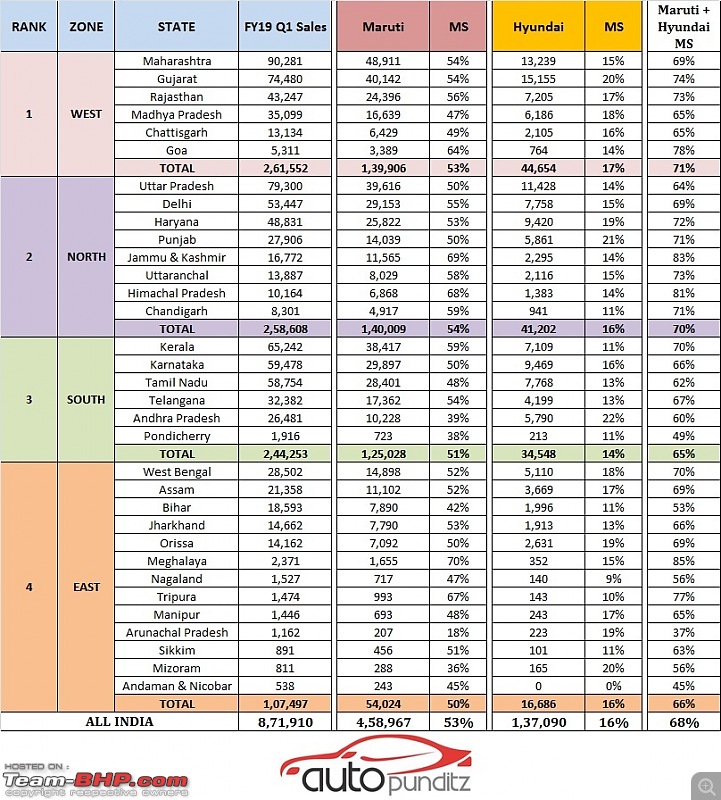
Ranking of States basis volumes, and their overall Market Share:

State-wise Car Sales in India : April 2016 to March 2017 (FY17)-24.jpg

Market reach data for top 2 OEMs.

Top 10 states contributed to ~70% of the national volumes. And Top 5 states contributed to ~42% of National Volumes. This is also an excellent indicator of statewise variance in terms of car sales.

-Maruti + Hyundai contributes to 68.36% of passenger vehicle sales in India. Maruti alone contributes to 52.6% of passenger vehicle sales!

- In Jammu & Kashmir, Maruti + Hyundai’s Market Share was a mind boggling 83%.

- In terms of Zone-wise presence – Maruti has the least market share in East Zone & Hyundai has the lowest Market Share in South Zone!

- Hyundai has single digit Market Shares only in 2 markets – Nagaland & Andaman!


State-wise Car Sales in India : April 2016 to March 2017 (FY17)-33.jpg

Source:

Last edited by volkman10 : 20th August 2018 at 08:46.
volkman10 is offline   (5) Thanks
Reply

Most Viewed


Copyright ©2000 - 2024, Team-BHP.com
Proudly powered by E2E Networks