Team-BHP
(
https://www.team-bhp.com/forum/)
Contribution of sales in its own Zone North Zone  South Zone
  East Zone
 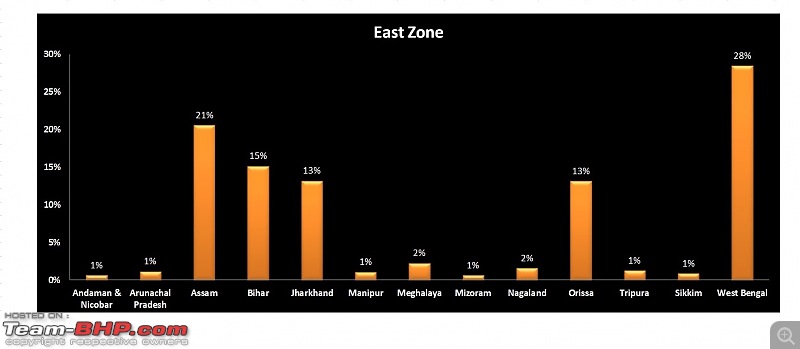 West Zone
  Contribution of sales compared to Pan India Sales North Zone
 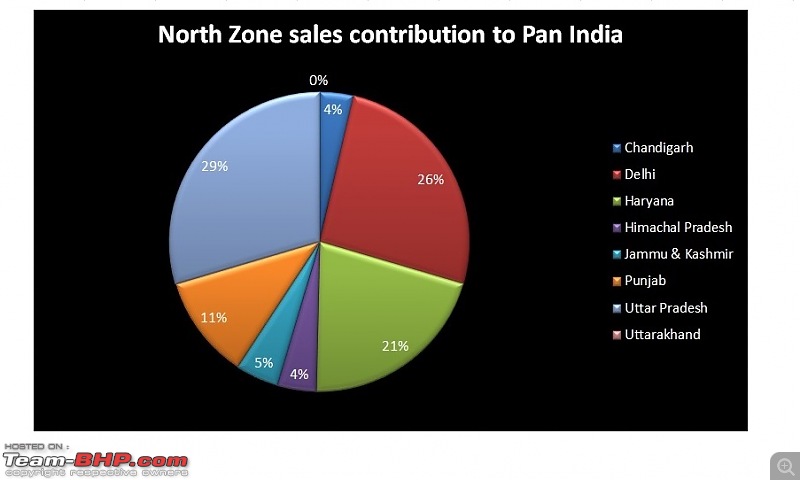 South Zone
 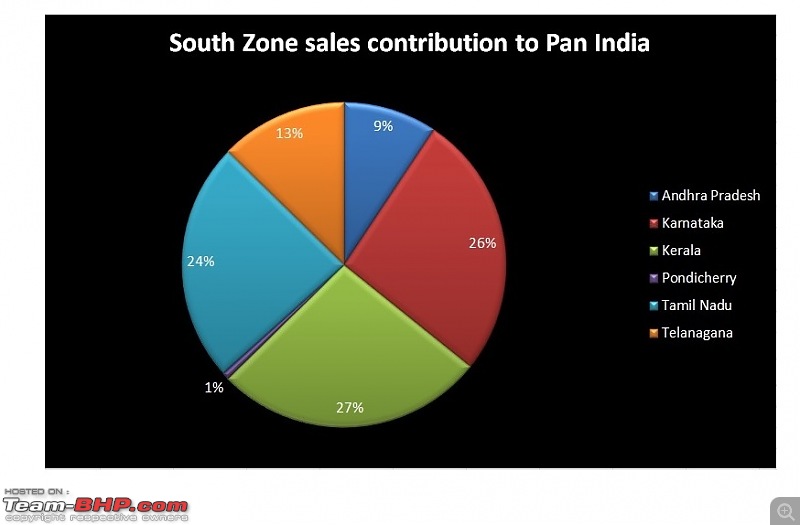 East Zone
 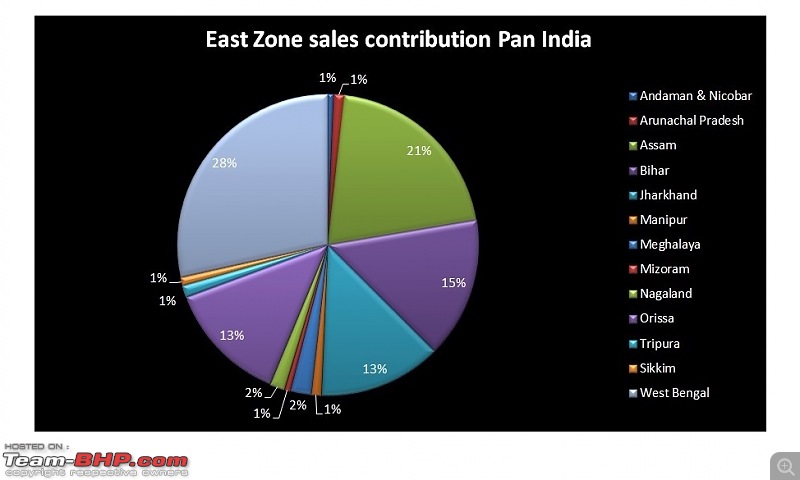 West Zone
Observations
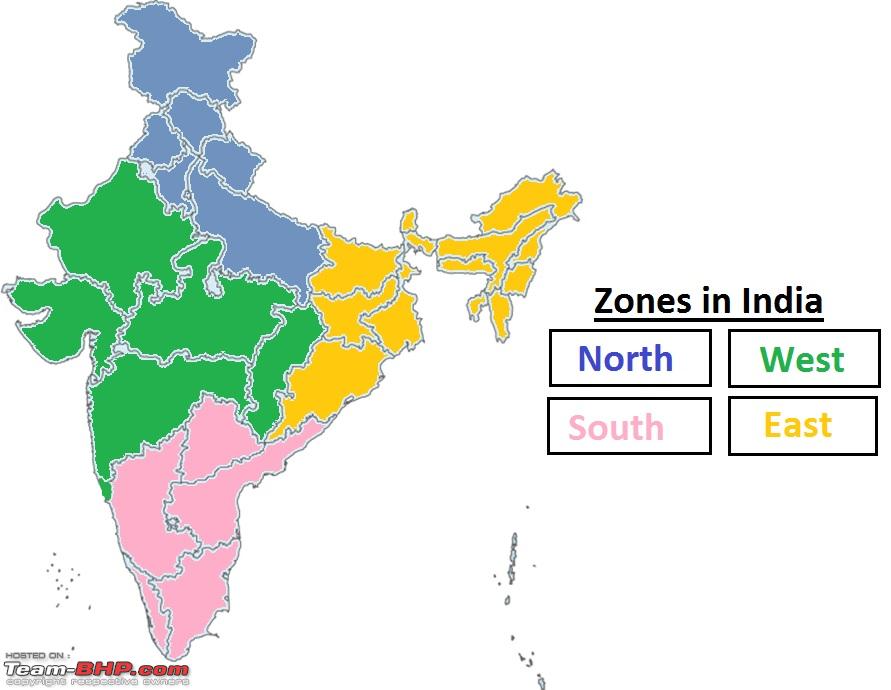
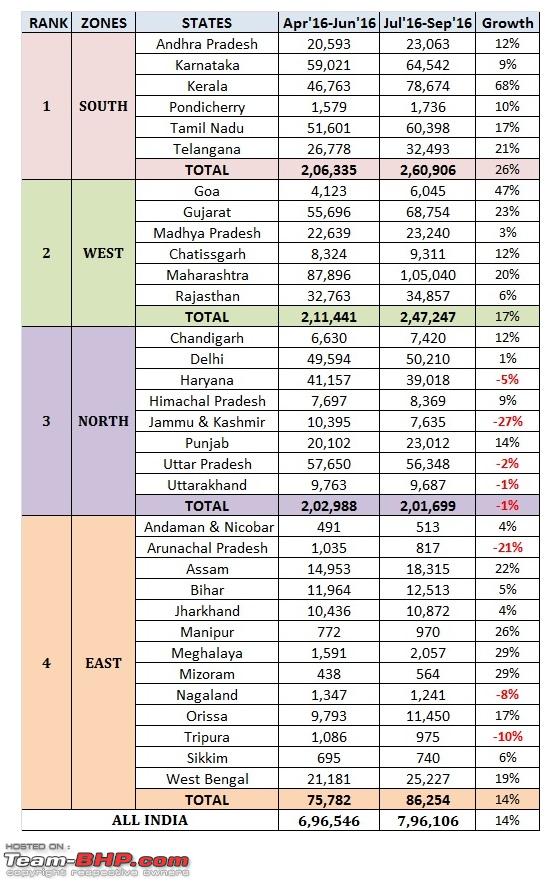
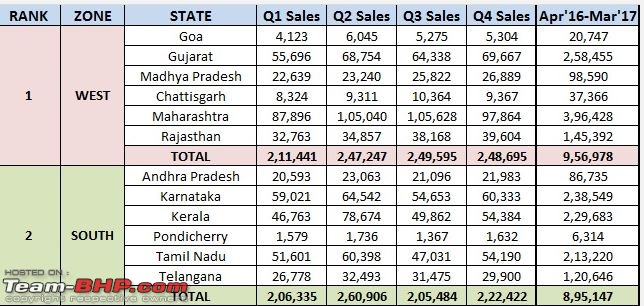
1. West and South zone are contributing equally at 31% each in sales volume Pan India compared to 11% of East zone and 26% of North zone.
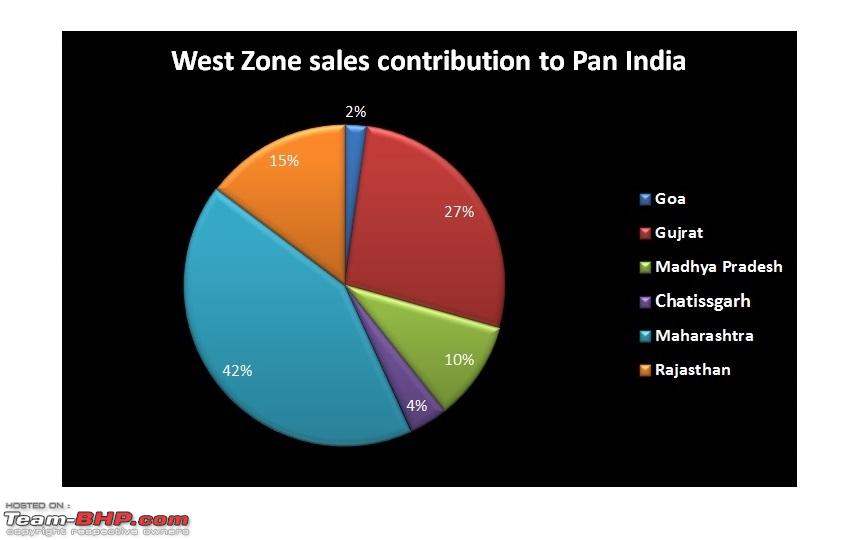
2. Of the total sales in the West zone, highest contribution comes from Maharastra at 13%.
3. In the South zone, sales percentages are standing same between Kerala, Karanataka and Andhra Pradesh at 8% each.
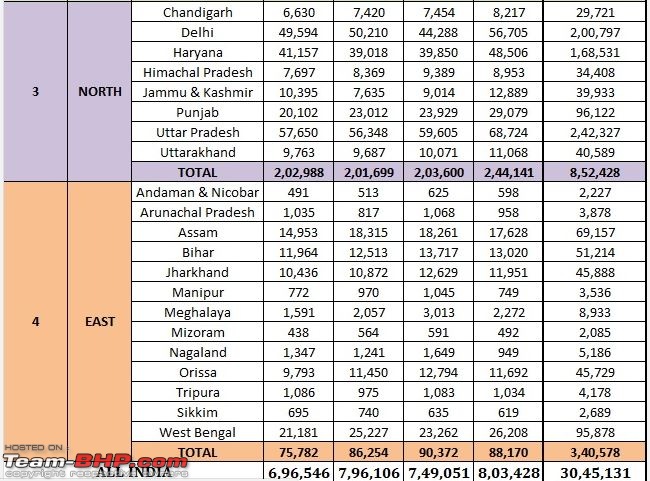
4. From the East zone, highest contribution coming from Kolkata at 3% followed by Assam and Bihar at 2% each.
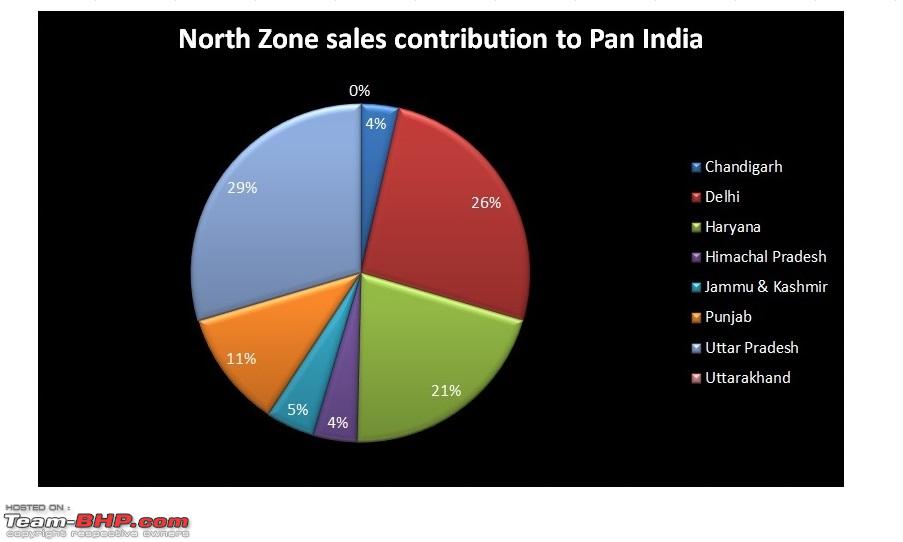
5. Whereas the North zone has its major contribution coming from Uttar Pradesh at 8% followed by Delhi at 7%.
When individual zones are looked into:
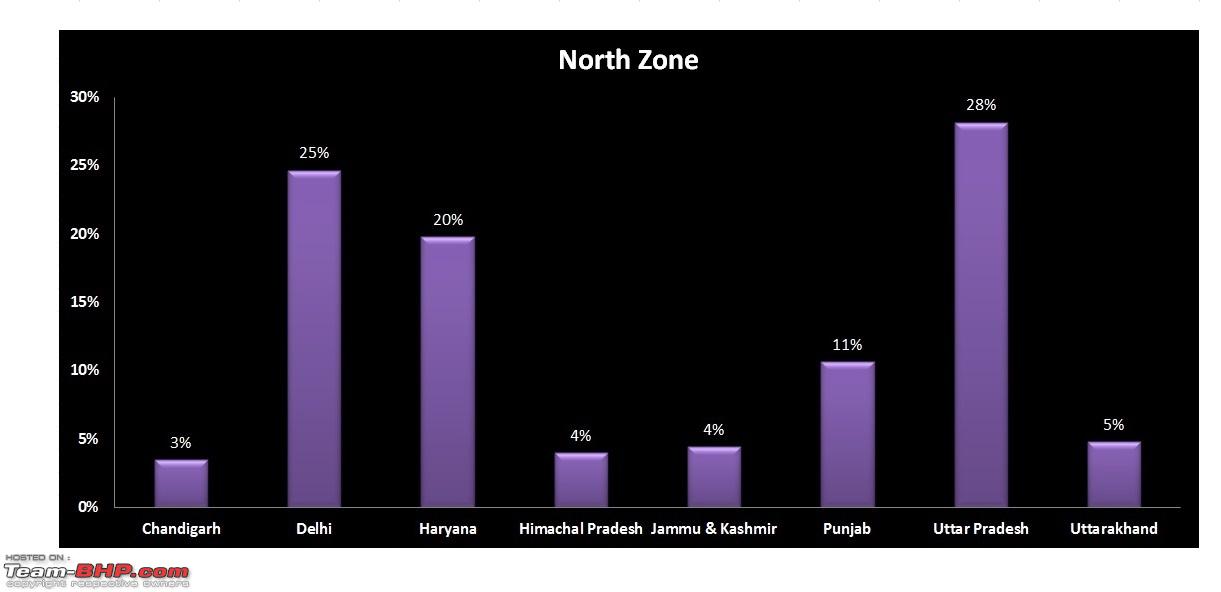
a. North Zone:
> Highest is Uttar Pradesh at 28%, Delhi is at 25% and Haryana at 20%
b.South Zone:
> Highest is Kerala at 27%, Karnataka is at 26% and Tamil Nadu at 24%
c. East Zone:
> Highest is West Bengal at 28%, Assam is at 21% and Bihar at 15%
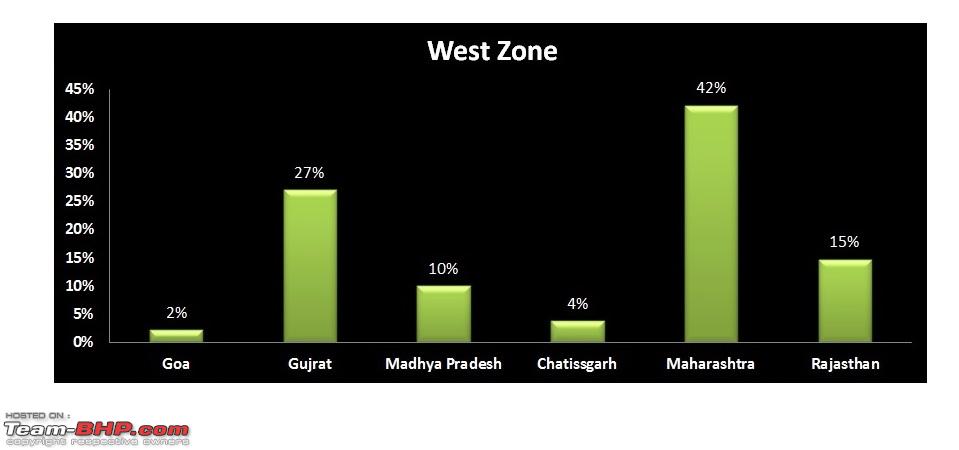
d. West Zone
> Highest is Maharastra at 42%, Gujrat is at 27% and Rajasthan at 15%
Thread moved from the Assembly Line. Thanks for sharing.
Great statistics. Thanks! Strange but Kerala is the leading buyer of cars for Jul-Sep 2016 in the whole of South India even if you put together Andhra and Telangana. Especially comparing the population ratio. Know what, they are the second highest buyers of cars in the whole India only after Maharashtra! They had a whopping 68% jump Qtr to Qtr. What they are eating and drinking lately!
Chandigarh is calculated separately and not with Punjab for known reason.
Punjab I thought will buy more but only 23k for that quarter.
South leads in whole of India.
MH is no 1 with 1 lakh cars.
Delhi alone as a Metro city buys 50k cars almost equalling UP!
Quote:
Originally Posted by sgmuser
(Post 4109385)
Great statistics. Thanks! Strange but Kerala is the leading buyer of cars for Jul-Sep 2016 in the whole of South India even if you put together Andhra and Telangana... They had a whopping 68% jump Qtr to Qtr.
|
This came as such a surprise for me! Kerala is already so crowded with hardly any space. Where are all the cars going?! A 68% growth? Could that be an issue of an abnormally low base in the previous quarter?
Quote:
Originally Posted by sgmuser
(Post 4109385)
Great statistics. Thanks! Strange but Kerala is the leading buyer of cars for Jul-Sep 2016 in the whole of South India even if you put together Andhra and Telangana. Especially comparing the population ratio. Know what, they are the second highest buyers of cars in the whole India only after Maharastra! They had a whopping 68% jump Qtr to Qtr. What they are eating and drinking lately!
|
Probably has got something to do with the festive season (Onam - falls in the Apr - Sep quarter) in Kerala. I'd hazard a guess that Delhi - most Northern states for that matter - will see a similar uptick during the Sep to Dec quarter owing to Diwali.
I'm curious about segment breakups by zones/states. Not sure if that data has been curated or not, but it should be interesting to see how the buying habits of people differ in different parts of the country.
Great thread, thanks for sharing.
It's a well know fact that Chandigarh has the highest number of cars per capita, and for a population of a million odd, that statistic remains unchanged. But Kerala is extremely surprising. As per the 2012 census its population is 34 million, less than half of either Karnataka or Tamil Nadu! Always read about how Kerala scores highly on social indicators, seems these have a cascading effect on material aspects eventually.
For similar population of around 27 million, Haryana has twice the vehicles as Punjab, clearly showing how Haryana has got a lot of things right over the past few decades.
Maharashtra/Gujrat should anyway not come as a surprise.
(PS: I know it might come across as a bit presumptuous to comment on the state of economy by car sales alone, but it ought to be a pretty strong indicator nonetheless. If it can be used to measure progress among nations, can't see any reason why it wont work between states.)
The top 4 states all have the Arabian Sea. How beautiful!!
The top 10 states can all be covered by road, going from one state to another: Start at TN->KL->KA->TS->MH->GJ->RJ->HR->DL->UP.
Kerala at No.2 is a real shocker. Especially considering that Kerala is 1/5th the size of Maharashtra, having 1/4th the road length compared to MH, and 1/5th population size compared to MH again.
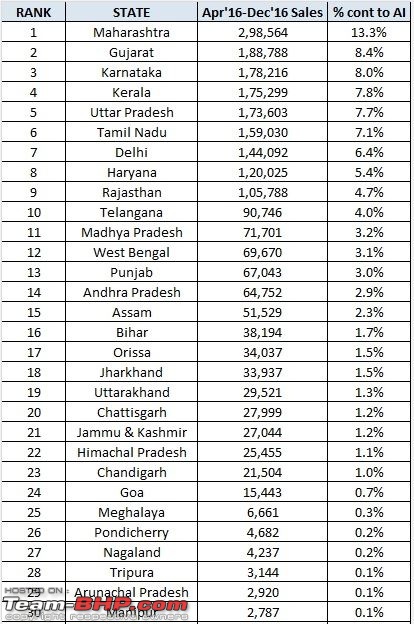
2016( Apr- Dec) State- wise break up of PV sales.
Quarter 3, probably due to the festive season, sees a change in the trend, West overtook South Zone by quite a margin and Maharashtra remained unshakable at the top slot.
Gujarat was able to dethrone Kerala from the Second position
Top Selling States for Apr’16-Dec’16 period:

 Link
Link
Kerala sales is actually not a shocker. A few years back, I had calculated the no of vehicles per square km based on per-capita car ownership of 2011 census - Kerala was placed second behind Delhi. In terms of per capita ownership, Punjab and Haryana were ahead
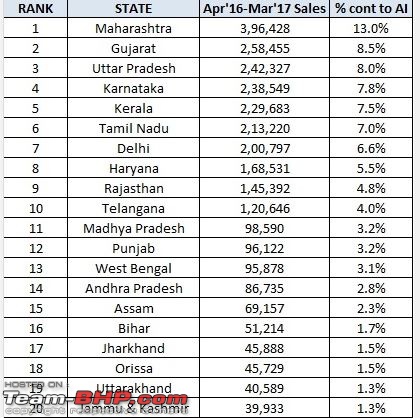
State-wise car sales
FY17.
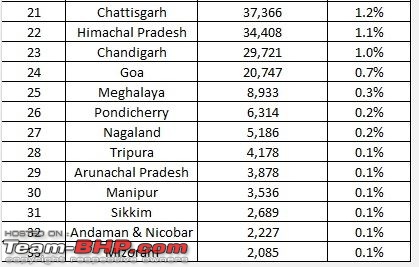
A look at the Top Selling States for Apr’16-Mar’17 period.
No state from South Zone in the Top 3 states of FY17 ,while South Zone is the second best zone in terms of numbers.
Kerala was the No.2 state in terms of Passenger vehicle sales in the first half of FY17, fell to No.5 position for the entire year.
 LINK
LINK
Quote:
A look at the Top Selling States for Apr’16-Mar’17 period.
|
Great information, any possibility to have segment vise information say Luxury segment - cars costing over 30 Lac?
| All times are GMT +5.5. The time now is 07:03. | |