I was accessing Vahan site (
https://vahan.nic.in/nrservices/) and came across the Vahan Dashboard. The numbers shown in the dashboard are very interesting and below is a quick summary of the same.
NOTE:
- Data is available from 2016
- This includes RTO data of 31 states (6 states are yet to move to Vahan)
- There isn't an option to obtain the raw data. I've manually copied some of the detailed numbers and done some analysis in addition to the data readily shown in Vahan dashboard.
Below is the snapshot of the dashboard. The online version can be accessed
here.
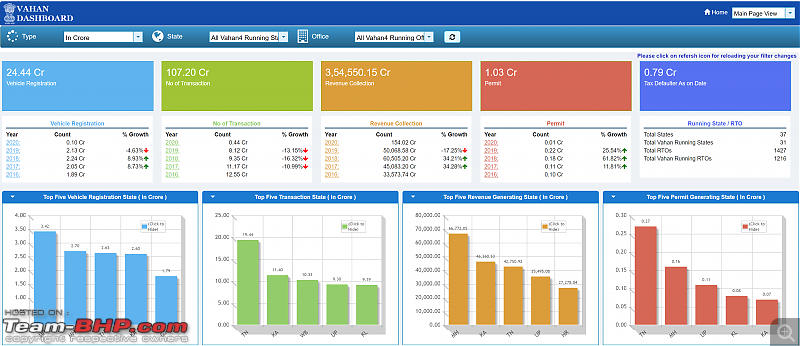
- 24.44 crore total registered vehicles in Vahan
- Approx 50,000 crore revenue in 2019
- 84% of the revenue is from MV tax (road tax)
- The reduction in revenue in 2019 (-17.25% YoY) is mainly attributed to the low new vehicle sales
- Another interesting fact is there are 1204 vehicle makers
- 855 makers have made less than 100 vehicles in 2019
- 251 makers have made between 100 and 1000 vehicles in 2019. This includes known players like Volvo, Mahindra Two Wheelers.
- 516 BS1 vehicles are registered in 2019, is this possible or is there something wrong with the data? (couldn't check the details of these vehicles as granular level data isn't available)
Below are a few more insights from the data. Please note only registration count value is available by vehicle category, the revenue numbers are not available at a granular level.
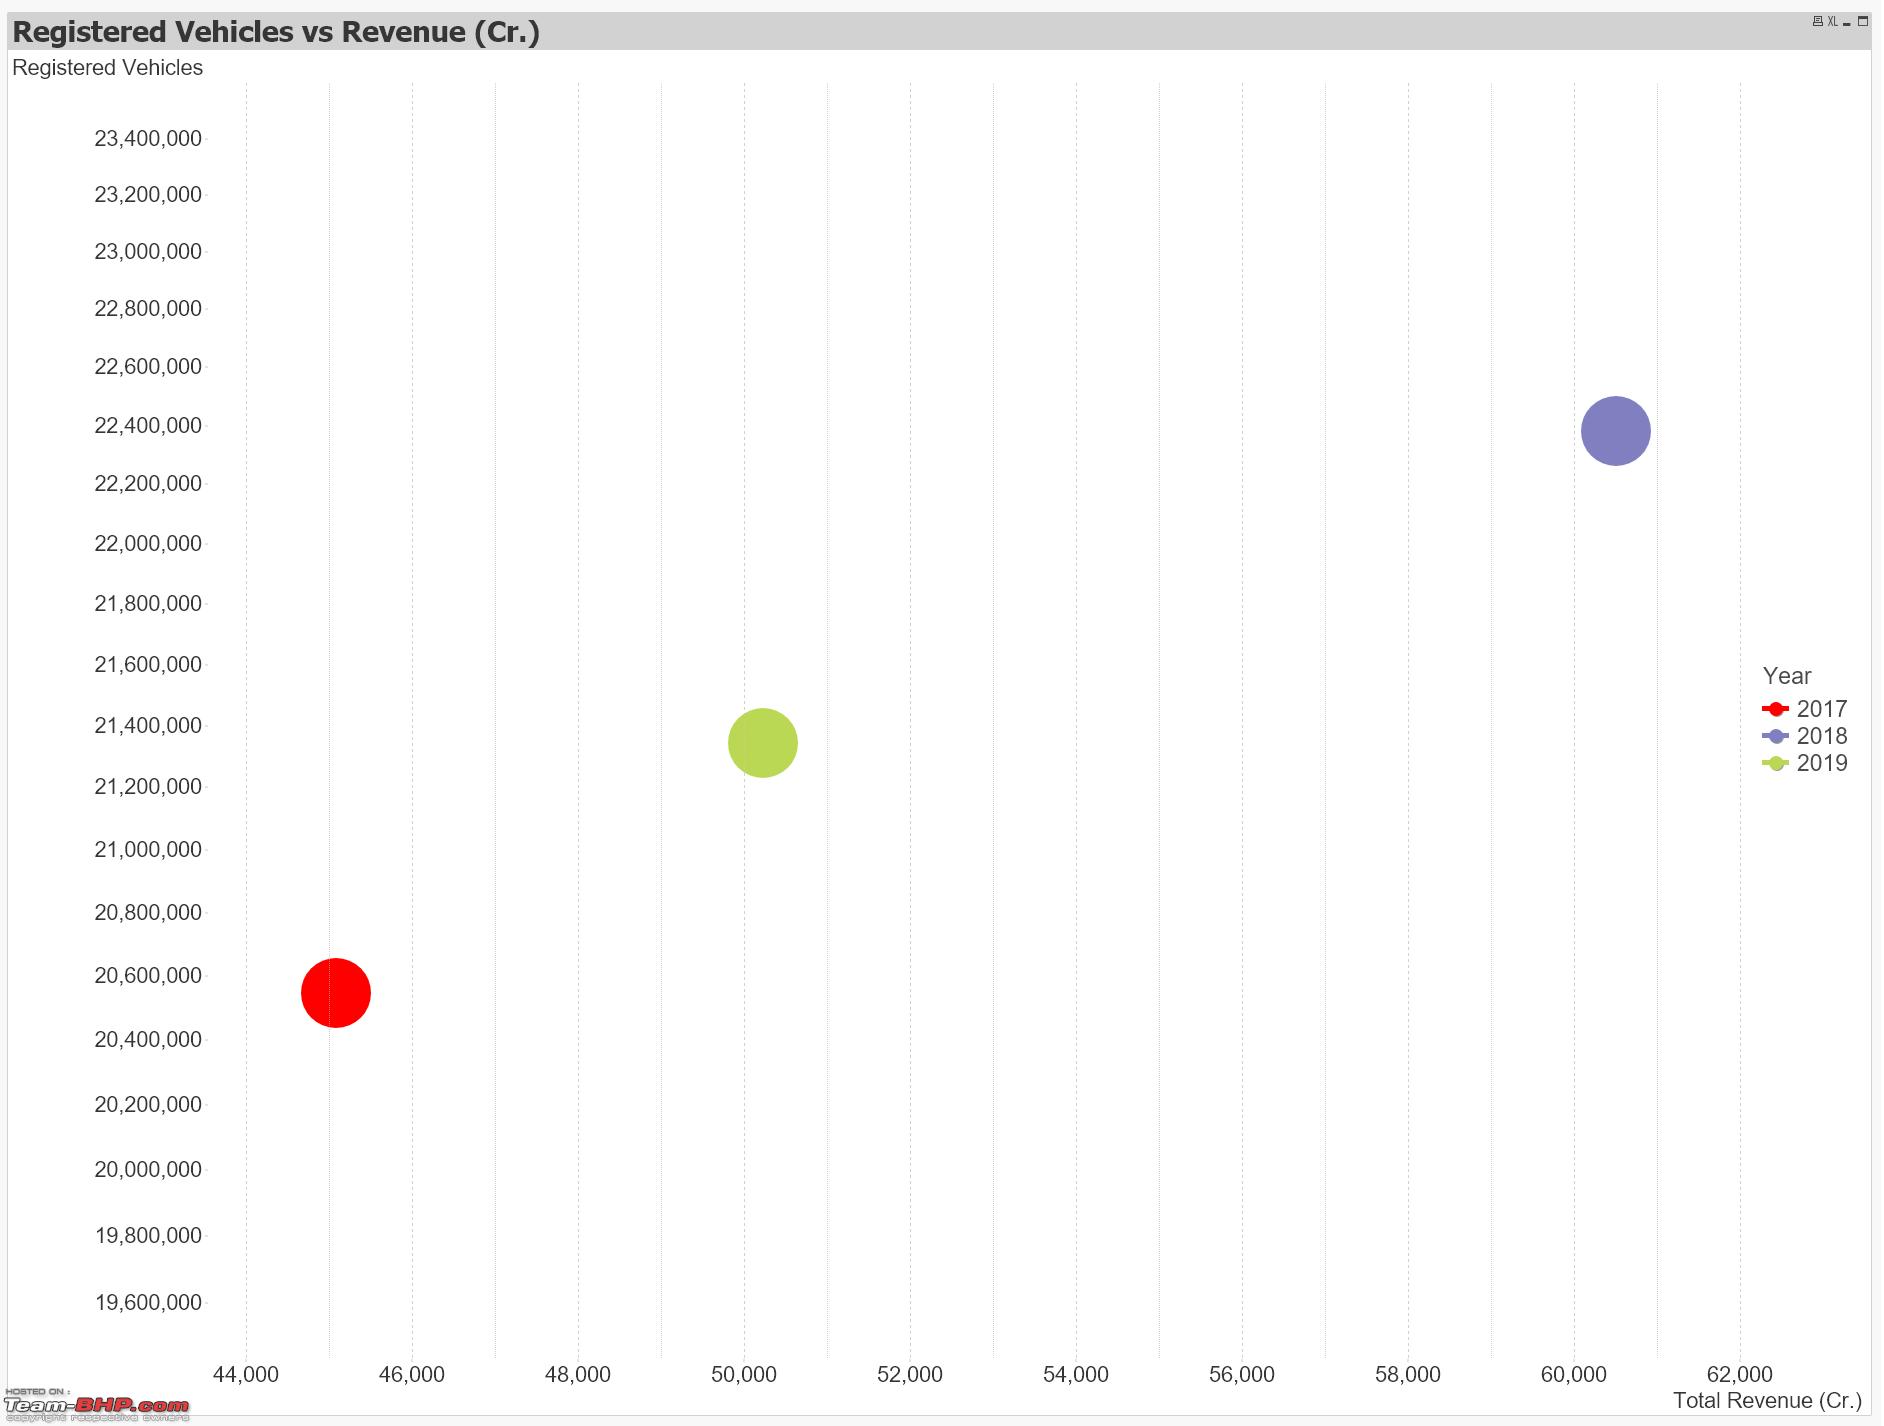
Chart plotting revenue and number of registrations at the year level:
- As expected, the revenue numbers are directly proportional to the number of registrations
- 2018 has the maximum values of the three years
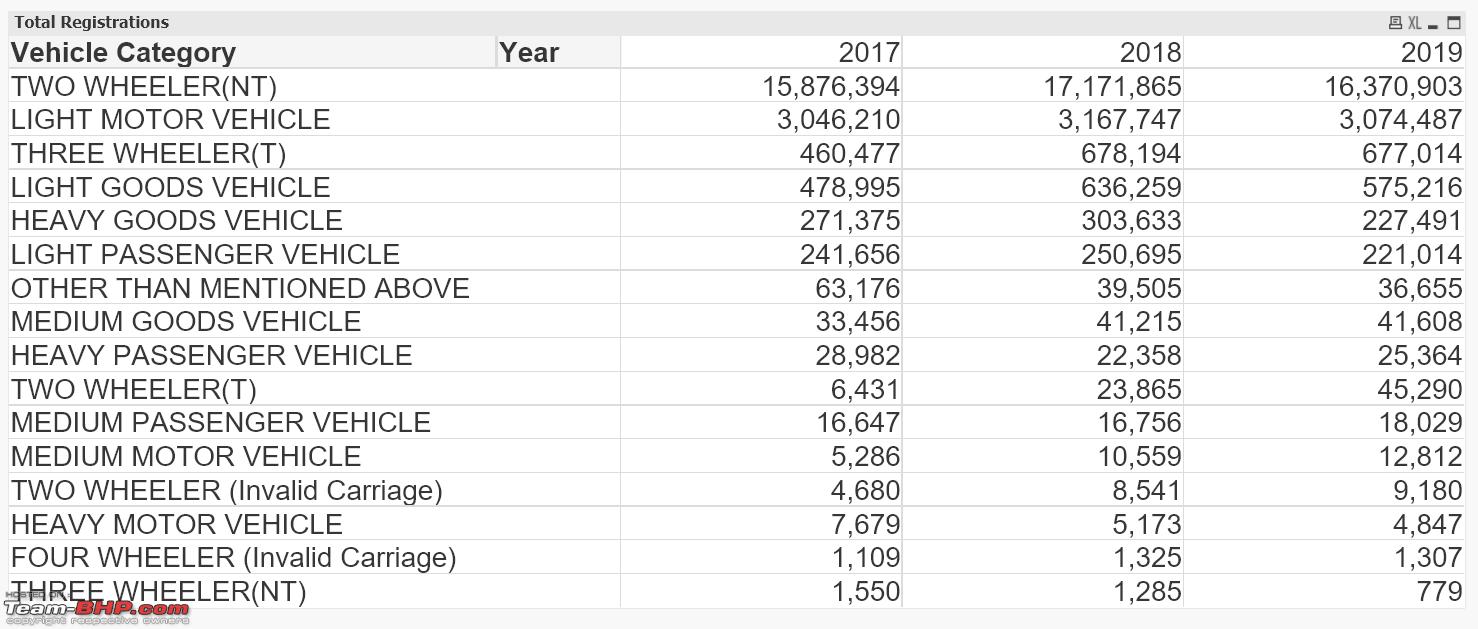
Number of registrations by vehicle category:

- No surprise to see Two-wheelers at the top
- There is huge growth in the Transport two-wheeler registration numbers. I guess more fundings for Bounce, Drivezy and the likes

- The LMV (personal cars) registrations haven't gone down a lot in 2019 (approx. -3% compared to 2018). Does this mean the car sales in 2019 isn't as bad as how it is projected? (of course, there is negative growth though it is negligible compared to overall numbers)
Number of registrations by vehicle class:

- Non Transport vehicle sales went down by 4.4% in 2019 compared to 2018
- Transport vehicle sales went down by 7.1% in 2019 compared to 2018. This could mean the overall demand for goods transport has gone done and isn't a good sign
Below table is a detailed list at vehicle subclass level:
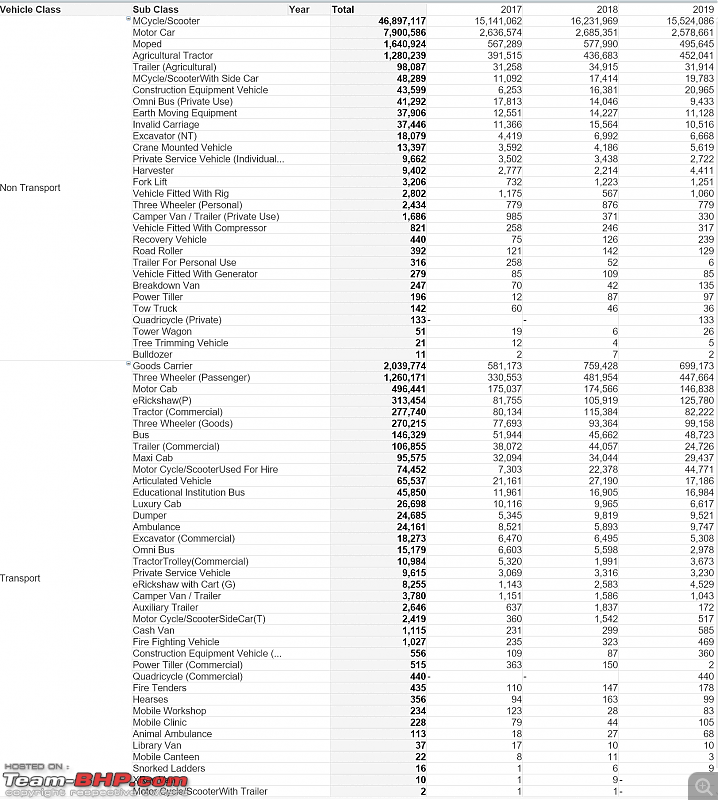
We could a lot more advanced analysis with the data. I have started with the basics and will try to add more advanced visualizations. It is good to have access to such data publicly. I've collated the data from Vahan into one single excel file and please DM me if you need it.
Note to mods: I couldn't find this info elsewhere on the forum and so created a new post. Kindly merge this with any existing post, if applicable.
Happy Motoring!
-Haneesh


 21st January 2020, 19:10

 (37)
Thanks
(37)
Thanks