| |||||||
| Search Forums |
| Advanced Search |
| Go to Page... |
 |
| Search this Thread |  609,194 views |
| | #181 |
| BHPian | Re: GM Beats Honda in Quality. I own a 2012 iVtec Honda City. My sparingly used (11,000kms) car now has both rear suspension replaced (under warranty), due to some manufacturing defect. No other problems though. Build quality is no where near German or Italian standards. Mod Note : Please do NOT use acronyms (e.g. ANHC, T-Fort, ANHV) when referring to cars. You are ONLY permitted to use the full Make & Model name for cars. This will make our content useful, searchable & easy-to-understand for experts & newbies alike. Any further usage of acronyms will invite Moderator action on your account. Thanks! Last edited by Aditya : 5th September 2015 at 07:10. Reason: ANHC changed to Honda City |
| |  (1)
Thanks (1)
Thanks
 |
| The following BHPian Thanks keeprevving for this useful post: | dark.knight |
| |
| | #182 |
| BANNED Join Date: Oct 2011 Location: Hyderabad
Posts: 12,350
Thanked: 21,411 Times
| 2015 - J D Power Study and Data This thread shall contain data based on the 2015 J. D. Power study. I'll be putting the key findings of each study done:
SOURCES: VDS Study SSI Study DSWAMI Study TCSI Study 2WAPEAL Study 2WIQS Study Last edited by a4anurag : 4th September 2015 at 11:02. |
| |  (4)
Thanks (4)
Thanks
 |
| The following 4 BHPians Thank a4anurag for this useful post: | ecosport rules, GTO, RavenAvi, Rehaan |
| | #183 |
| BANNED Join Date: Oct 2011 Location: Hyderabad
Posts: 12,350
Thanked: 21,411 Times
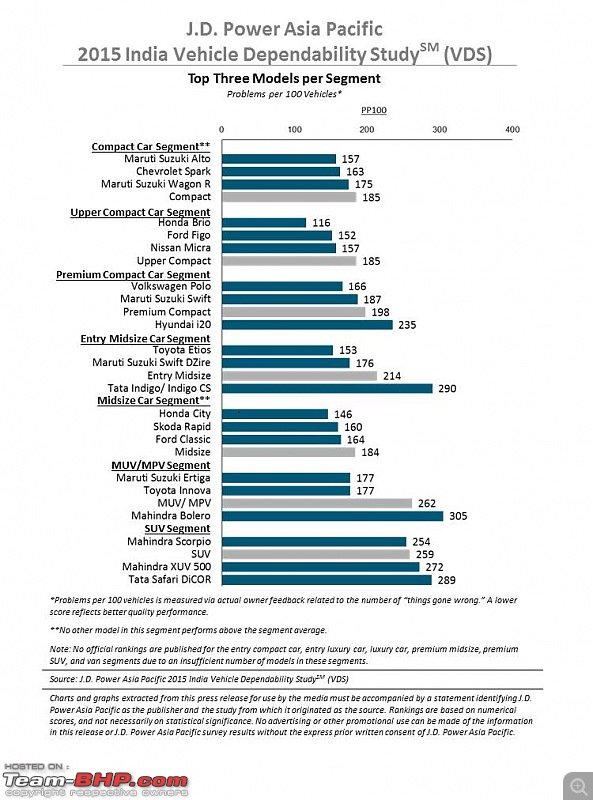
| Re: 2015 - J D Power Study and Data Newer Models Propel Improvements in Long-Term Vehicle Dependability in India (VDS) Honda, Maruti Suzuki and Toyota Each Receive Two Model-Level Awards New model launches propel improvements in long-term vehicle dependability in India as owners of these models report fewer problems than owners of existing or continuing models, according to the J.D. Power Asia Pacific 2015 India Vehicle Dependability Study. The study, now in its eighth year, measures problems experienced by original owners of 30- to 42-month-old vehicles in 169 different problem symptoms across nine vehicle categories:
Overall dependability is based on the number of problems reported per 100 vehicles (PP100), with a lower score reflecting higher long-term vehicle quality. “Improvements in styling, material usage and build quality on models that were newly introduced at the time of purchase are helping enhance perceptions of durability with respect to vehicle exterior,” said Mohit Arora, executive director at J.D. Power Asia Pacific, Singapore. “Additionally, with improved engine technologies that provide better fuel efficiencies, car owners are reporting fewer engine-related problems.” “With the increase in second- and third-row occupancy, it is imperative for automakers to provide a reliable HVAC unit that optimizes the air-conditioning effectiveness for all the occupants.” KEY FINDINGS
2015 India VDS Rankings
The 2015 India Vehicle Dependability Study (VDS) is based on evaluations from 8,507 original owners who purchased a new vehicle between July 2011 and September 2012. The study includes 65 models covering 16 nameplates and was fielded from January through April 2015 in 30 cities across India. The VDS is one of two J.D. Power Asia Pacific automotive quality studies for the India market. The 2015 India Initial Quality Study (IQS), which measures problems of new vehicles at 2 to 6 months of ownership, will be published in November.  Last edited by a4anurag : 4th September 2015 at 11:06. |
| |  (6)
Thanks (6)
Thanks
 |
| The following 6 BHPians Thank a4anurag for this useful post: | ecosport rules, GTO, RavenAvi, Rehaan, Simhi, V.Narayan |
| | #184 |
| BANNED Join Date: Oct 2011 Location: Hyderabad
Posts: 12,350
Thanked: 21,411 Times
| Re: 2015 - J D Power Study and Data Greater Focus on Maximizing Sales Conversions Impact Customer Satisfaction with the Purchase Experience at Dealerships in India (SSI) Mahindra and Toyota Rank Highest in a Tie in Sales Satisfaction among Mass Market Brands in India As shopping traffic for new vehicles has increased at showrooms in India, dealers have focused on maximizing sales conversions rather than providing a satisfying customer purchase experience, according to the J.D. Power Asia Pacific 2015 India Sales Satisfaction Index (SSI) Study. The study examines seven factors that contribute to new-vehicle owners’ overall satisfaction with their sales experience (listed in order of importance):
Satisfaction is calculated on a 1,000-point scale. KEY FINDINGS
Study Rankings
  Last edited by a4anurag : 4th September 2015 at 11:09. |
| |  (4)
Thanks (4)
Thanks
 |
| The following 4 BHPians Thank a4anurag for this useful post: | ecosport rules, GTO, RavenAvi, Rehaan |
| | #185 |
| BANNED Join Date: Oct 2011 Location: Hyderabad
Posts: 12,350
Thanked: 21,411 Times
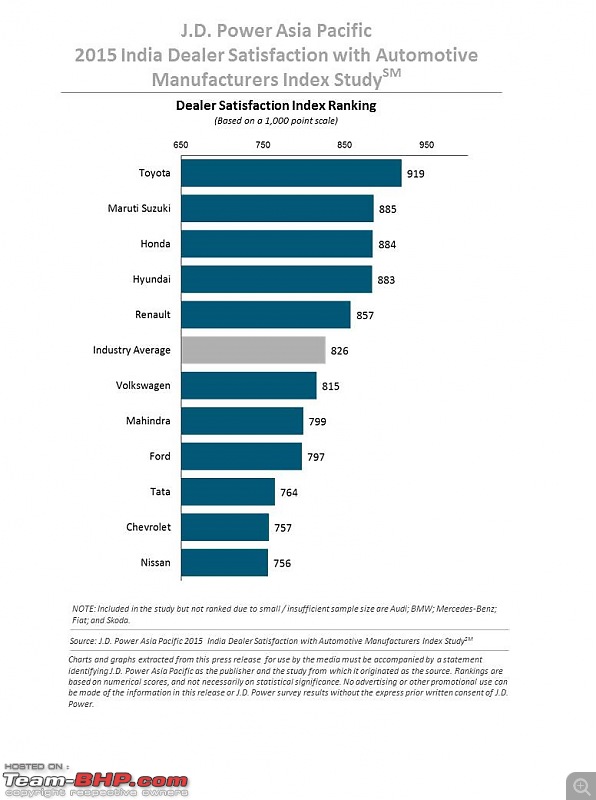
| Re: 2015 - J D Power Study and Data Dealer Optimism Increases in India as Passenger Car Sales Improve (DSWAMI) Toyota Ranks Highest in Dealer Satisfaction with Automotive Manufacturers The study finds that 56 percent of dealers in India estimate that their financial performance in fiscal year 2015 will improve, compared with fiscal year 2014. In the 2014 study, only 46 percent of dealers indicated that their financial performance will be better than last year. Now in its fifth year, the study measures dealer satisfaction with vehicle manufacturers or importers in India and identifies dealer attitudes regarding the automotive retail business. Overall dealer satisfaction is determined by examining nine factors:
KEY FINDINGS
Study Rankings
The 2015 India DSWAMI Study is based on responses from 734 dealer principals or dealership general managers located in more than 250 cities throughout India. The study was conducted in association with the Federation of Automobile Dealers Associations (FADA) and was fielded between January and March 2015.   |
| |  (4)
Thanks (4)
Thanks
 |
| The following 4 BHPians Thank a4anurag for this useful post: | ecosport rules, GTO, RavenAvi, Rehaan |
| | #186 |
| BANNED Join Date: Oct 2011 Location: Hyderabad
Posts: 12,350
Thanked: 21,411 Times
| Re: 2015 - J D Power Study and Data Sharp Reduction in Number of Customer-Reported Problems with Original Equipment Tires Over Past Five Years in India (TCSI) JK Tyre Ranks Highest in Customer Satisfaction with Original Equipment Tires There has been a significant reduction in customer-reported problems with original equipment (OE) fitted tires during the past five years in India, indicating improvement in the quality of OE fitted tires, according to the J.D. Power Asia Pacific 2015 India Original Equipment Tire Customer Satisfaction Index (TCSI) Study. The study, now in its 15th year, measures satisfaction among original equipment tire owners during the first 12 to 24 months of ownership across four factors (listed in order of importance):
The overall incidence of problems cited by customers has dropped significantly to 9 percent in 2015 from 18 percent in 2010. That decline is primarily due to a notable reduction in the percentage of reported problems with frequent punctures—the most commonly cited problem—to 57 percent from 77 percent in 2010. “With the continuous quality and performance improvement of OE fitted tires over the past five years, customers are increasingly satisfied,” said Mohit Arora, executive director, J.D. Power Asia Pacific. KEY FINDINGS
Study Rankings
The 2015 India Original Equipment Tire Customer Satisfaction Index (TCSI) Study is based on 4,079 responses from new-vehicle owners who purchased their vehicle between May 2012 and August 2013. The study was fielded between May and August 2014.  |
| |  (4)
Thanks (4)
Thanks
 |
| The following 4 BHPians Thank a4anurag for this useful post: | ecosport rules, GTO, RavenAvi, Rehaan |
| | #187 |
| BANNED Join Date: Oct 2011 Location: Hyderabad
Posts: 12,350
Thanked: 21,411 Times
| Re: 2015 - J D Power Study and Data Influencers of Product Performance Satisfaction Differ Sharply across Two-Wheeler Segments (2WAPEAL) Hero, Honda, TVS and Yamaha Each Receive Model-Level Awards for Two-Wheeler APEAL The India Two-Wheeler APEAL Study, which serves as the industry benchmark for new two-wheeler appeal, measures how gratifying a new two-wheeler is to own and ride based on owner evaluations during the first two to six months of ownership. The study examines 33 attributes across six performance categories:
Overall APEAL performance is reported as an index score based on a 1,000-point scale, with a higher score indicating higher satisfaction. The two-wheeler models in this study are classified into scooters and motorcycles. Scooters include two model segments: economy and executive. Motorcycles include five model segments: economy, executive, upper executive, premium and premium plus. “There are different drivers of performance satisfaction in each product segment, and each product segment appeals to a specific demographic,” said Mohit Arora, executive director, J.D. Power Asia Pacific. Study Rankings
KEY FINDINGS
The 2015 India Two-Wheeler Automotive Performance, Execution and Layout (2WAPEAL) Study is based on evaluations from 10,283 vehicle owners who purchased a new vehicle between March 2014 and October 2014. The study includes 81 two-wheeler models from nine makes. The study was fielded from September 2014 to December 2014 in 45 cities across India.  |
| |  (4)
Thanks (4)
Thanks
 |
| The following 4 BHPians Thank a4anurag for this useful post: | ecosport rules, GTO, RavenAvi, Rehaan |
| | #188 |
| BANNED Join Date: Oct 2011 Location: Hyderabad
Posts: 12,350
Thanked: 21,411 Times
| Re: 2015 - J D Power Study and Data Two-Wheeler Owners in India Report High Incidence of Initial Quality Problems with Engine, Fit and Finish, Electricals and Brakes (2WIQS) Bajaj, Hero, TVS and Yamaha Each Receive Model-Level Awards for Two-Wheeler Initial Quality Nearly three-fourths (70%) of initial quality problems reported by two-wheeler owners in India are experienced in the engine, fit and finish, lights/electricals and brakes categories, according to the inaugural J.D. Power 2015 India Two-Wheeler Initial Quality Study (2WIQS) Study. The study measures problems owners experience with their new two-wheeler during the first two to six months of ownership. It examines 138 problem symptoms covering seven two-wheeler problem categories (listed in order of frequency of reported problems):
All problems are summarized as the number of problems per 100 vehicles (PP100). Lower PP100 scores indicate a lower rate of problem incidence and therefore higher initial quality. >> “Many reported problems impact vehicle usage and varied driving conditions. Therefore, OEMs need to focus on these issues to improve performance quality and enhance vehicle safety and visibility,” said Mohit Arora, executive director, J.D. Power Asia Pacific. “The Two-Wheeler Initial Quality Study provides the industry with key information about customer expectations and establishes a benchmark to measure performance against the competition.” >> The most frequently cited problem symptoms include excessive fuel consumption, engine is hard to start, lights not bright enough – headlight, brakes are ineffective/ don’t have enough stopping power, and brakes are too sensitive. >> The study finds that 80 percent of two-wheeler owners use their vehicle for daily commuting, averaging about 40 kilometers per day. Given this high usage, nearly one-third (27%) of two-wheeler owners have reported mileage / fuel economy as the top main reason to purchase a new two-wheeler. KEY FINDINGS
Study Rankings
The 2015 India Two-Wheeler Initial Quality Study (2WIQS) is based on evaluations from 10,285 vehicle owners who purchased a new vehicle between March 2014 and October 2014. The study includes 81 two-wheeler models from nine makes. The study was fielded from September 2014 to December 2014 in 45 cities across India.  Last edited by a4anurag : 4th September 2015 at 11:10. |
| |  (5)
Thanks (5)
Thanks
 |
| The following 5 BHPians Thank a4anurag for this useful post: | ecosport rules, GTO, Leoshashi, RavenAvi, Rehaan |
| | #189 | |
| Distinguished - BHPian  | Re: The "JD Power Study" Thread Maruti-Suzuki is ranked the highest in the J.D. Power Asia Pacific 2015 India Brand Influence and Positioning Study, the results of which were published by a press release 2 days back.  Quote:
| |
| |  (2)
Thanks (2)
Thanks
 |
| The following 2 BHPians Thank RavenAvi for this useful post: | a4anurag, GTO |
| | #190 | ||
| Distinguished - BHPian  Join Date: Aug 2011 Location: Bangalore
Posts: 4,606
Thanked: 17,684 Times
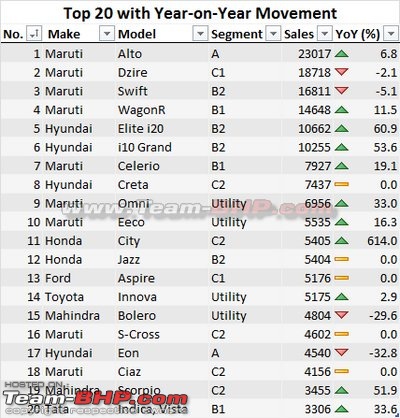
| J.D.Power Study 2015-Indians moving away from small cars towards larger models As per the latest J.D Power Study, there is a 20% drop in new car buyers considering small cars. 45% in 2015 as opposed to 65% in 2012. Source Links: IAB EEAuto Quote:
Another interesting point from the survey is that buyers are now much more receptive to buying new models. The tremendous interest generated by models like Creta, Aspire, Kwid, S-Cross prove this point (Although the survey probably does not cover these models) Quote:
  The list is dominated by the B2, C1, C2 and Utlity segments. I guess if this survey is done again next year, the drop will be even bigger since we have several blockbuster premium models launched since April 2015 (Which was the cut off for this survey) Last edited by Rajeevraj : 2nd October 2015 at 12:22. | ||
| |  (1)
Thanks (1)
Thanks
 |
| The following BHPian Thanks Rajeevraj for this useful post: | GTO |
| | #191 |
| BHPian | J.D. Power 2015 India Customer Service Index (CSI) StudySM - Study Maruti tops J.D. Power 2015 India Customer Service Index (CSI) StudySM - Study. Honda comes second. Third place is jointly held by Hyundai and Tata. Yes, you heard it right...Tata. Kudos to Maruti for bagging the 1st position yet again. Great to see Tata doing wonder in Customer Service Index (CSI). For more details check out this link: http://goo.gl/VwkBN0 Source: http://www.jdpower.com |
| |  (5)
Thanks (5)
Thanks
 |
| The following 5 BHPians Thank keeprevving for this useful post: | GTO, mrbaddy, shashanka, theexperthand, VeluM |
| |
| | #192 |
| Newbie Join Date: Jan 2015 Location: Tuticorin
Posts: 10
Thanked: 67 Times
| Re: J.D. Power 2015 India Customer Service Index (CSI) StudySM - Study Maruti Suzuki has maintained the number 1 position for the 16th year in a row. I think that is a commendable job done by Maruti Suzuki.    As market leaders, they have shown other players on how to sell cars and service customers. |
| |  ()
Thanks ()
Thanks
 |
| | #193 |
| Distinguished - BHPian  Join Date: Sep 2010 Location: Liverpool/Delhi
Posts: 5,439
Thanked: 7,540 Times
| Re: J.D. Power 2015 India Customer Service Index (CSI) StudySM - Study I am honestly not convinced with these findings. Toyota being so low in the list and Nissan being so high up, infact right after Toyota. My experience with the two brands has been drastically opposite of that. Only sensible part of that result is the last spot for Skoda as per me. |
| |  (5)
Thanks (5)
Thanks
 |
| The following 5 BHPians Thank drmohitg for this useful post: | adimicra, arunphilip, GTO, iliketurtles, rrsteer |
| | #194 | |
| BHPian | Re: J.D. Power 2015 India Customer Service Index (CSI) StudySM - Study Quote:
| |
| |  ()
Thanks ()
Thanks
 |
| | #195 | ||
| Senior - BHPian Join Date: Jul 2008 Location: Bangalore
Posts: 1,777
Thanked: 1,479 Times
| Re: J.D. Power 2015 India Customer Service Index (CSI) StudySM - Study Quote:
Quote:
Tata moving up is understandable, they have done a lot to move up the ladder, but I don't think they could have jumped to the third spot so quickly. Skoda is consistently at the bottom despite a lot of hype by the CEO last year. I own a Skoda and completely agree with the ranking. Surprising about Toyota. This is actually what convinces me that the rankings are wrong, unless unrealistic perception is what is bringing their ranking down. Case of their own brilliance causing them harm. Or could it be the cabbies? I don't think commercial vehicles are included in these surveys, but I have heard from a cab driver and owner of an Etios that the Etios is not a completely worry/issue free vehicle like other Toyotas (especially Innova). I didn't ask for details, now wish that I had. Last edited by VeluM : 2nd November 2015 at 18:56. | ||
| |  (1)
Thanks (1)
Thanks
 |
| The following BHPian Thanks VeluM for this useful post: | KiloAlpha |
 |


