Team-BHP > Motor-Sports > Indian Motorsport
Register New Topics New Posts Top Thanked Team-BHP FAQ


Closed Thread
  Search this Thread
26,129 views
Old 6th April 2009, 22:30   #76
Distinguished - BHPian
 
khan_sultan's Avatar
 
Join Date: Apr 2006
Location: Noida/Bangalore
Posts: 4,925
Thanked: 5,853 Times

Quote:
Originally Posted by d3mon View Post
... some problem in calibrating the software or mounting the iphone in your car.
Calibration is OK.
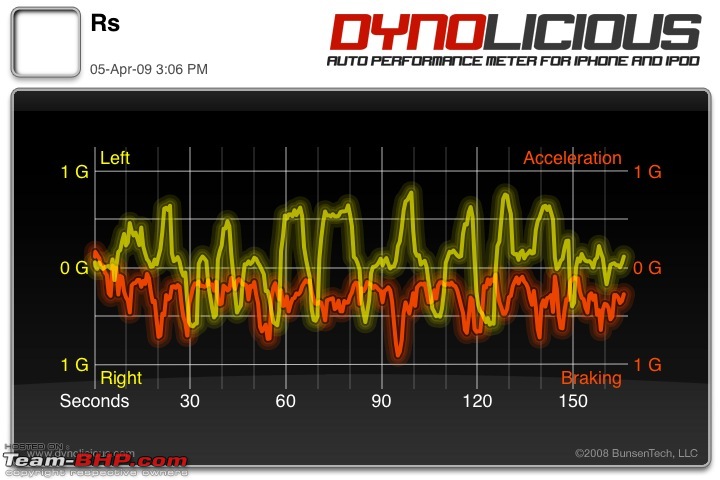
Oh yes, the G force/Braking graph above is for the safari and it was mounted very very securely.

Quote:
Originally Posted by iceman91 View Post
no the phone was held in hrag's hands
That graph is here -- for the Palio. Forget the accuracy for the moment, do the peak yellow points denote the curves? And can we make out which part of graph is which corner (c1 c2...) from this graph?

TRACK DAY? P & P Report-img_0018.jpg

Last edited by khan_sultan : 6th April 2009 at 22:34.
khan_sultan is offline  
Old 6th April 2009, 22:37   #77
Senior - BHPian
 
binz's Avatar
 
Join Date: Aug 2005
Location: Bangalore
Posts: 1,306
Thanked: 431 Times

The sx4 video. Speedo did show 170 but note that the car was running 195/55/15 on the font.

Too lazy to do the math

binz is offline  
Old 6th April 2009, 22:48   #78
Senior - BHPian
 
Rahulkool's Avatar
 
Join Date: Oct 2007
Location: Chennai
Posts: 1,386
Thanked: 1,416 Times

few pics from the trackday Trackday 05.04.2009 - a set on Flickr
Rahulkool is offline  
Old 6th April 2009, 22:56   #79
Senior - BHPian
 
binz's Avatar
 
Join Date: Aug 2005
Location: Bangalore
Posts: 1,306
Thanked: 431 Times

Youtube is messing up video quality,what to do?

Guys,i hope you don't mind if i posted your pics on my facebook account for the people who aren't on t-bhp.

Please let me know if you would not like me to do so.
binz is offline  
Old 6th April 2009, 23:02   #80
BHPian
 
swift8847's Avatar
 
Join Date: Aug 2007
Location: Bangalore/Houston
Posts: 324
Thanked: 2 Times

Amazing video Binz.

@Rahul: you must have had fun testing that baby.

Why did I ever miss this one?
swift8847 is offline  
Old 6th April 2009, 23:35   #81
BHPian
 
petrol_head's Avatar
 
Join Date: Mar 2009
Location: Madras
Posts: 234
Thanked: 60 Times

Quote:
Originally Posted by khan_sultan View Post
While people were bust setting fastest lap time records, I was busy testing out the dynolicious. Unfortunately, I can't make head or tail out of this. Can someone help me analyze and decode these graphs for me?

What do these mean?
Awrite. Just something that I thought about the graphs. Gurus kindly don't take off on me if im wrong. Just a thought.

Graph one.
The acceleration curve (red) states that the car is doing around 95 at the ten second mark and 125 odd around the 19 second mark. The doubt that arises is whether the car was held down (read as not accelerated upon / throttle held at a fixed position / feathered in intervals) after peaking out in 1st gear and up shifting into 2nd since the acceleration curve remains more or less constant till about the 15 second mark which is also complimented by the dropping HP curve which stays down till about the same time (15 second mark) after which there is a surge in both the acceleration curve as well as the HP curve. As far as the G force curve (blue) is concerned, the central point from where it starts being the 0 g point, the acceleration creates positive G all the way up till the same 10 second mark after which the g curve reads almost negligible positive g as the car was not accelerated upon after that till about the same 15 second mark where the HP curve and the acceleration curve surge upwards. There is no negative G present since there was no braking involved.

My only doubt is - the graph shows the car producing 125 Hp at the peak of its power band in 1st gear at the same point where the car has almost touched 80 kmph and 150 HP at the peak of the powerband in 2nd gear . On a stock Palio 1.6?

Summary - Car accelerates to 80 in 1st gear while the engine is pushing out 125 Hp and after shifting to second the throttle is held constant / not acted upon / feathered till about the 15 second mark which results in the constant speed with no surge as well as the HP curve dropping. There is surge in both the curves as the car reaches the 120 mark in 2nd gear. Guess this is what the graph reads, but impossible on a stock car.

Graph 2
The acceleration curve (yellow) indicates the positive Gs experienced upon acceleration and the braking curve (red) indicates the negative Gs experienced upon deceleration. The chart does not begin with the car at rest, or rather the reading starts at a point where the car is braking. At a point where the car is stationary, both the curves would overlap each other at the 0 line. Every time the car accelerates ie. the yellow curve moves up, there is a dip in the red curve due to the negative impact on the negative Gs. Similarly every time when the car undergoes braking, there is a surge in the negative Gs with a complimented negative effect on the positive Gs which results in the red curve dropping and the yellow curve ascending. This explains why everytime the yellow curve moves up, the red curve moves down and when the yellow curve moves down on deceleration, the red curve moves up. This is a pattern which is pretty constant through the whole graph. My doubt again is if the calibration is right as the position of the red curve seems to have shifted down though the pattern seems to be right.
The graph indicates, a max of .5 Gs (positive) at any point of time and max negative Gs of around 1 G through the chart. The negative gs seem to be quite high. stock road cars are not designed to brake with decelerating force of 1g (ie 35kmph per second) A car accelerating at an average of 17.5 kmph a second would be doing around .5 g and I bet that 1.6 engine in the peak of its powerband would be doing more than that. Which is why i believe that both yellow as well as the red curve are placed a few notches too low. If the yellow curve shifts upwards, it would mean that while accelerating the car would be doing more than .5 g which i think would be right. The pattern seems to be fine. I feel both the curves should be actually be a little higher than what the graph states.

@ khan ji's second post. The second graph (safari) seems more sane than the one for the palio. If you notice the peak negative Gs are less far lesser than one and the positive Gs are above .5gs. If a safari can accelerate at more than .5 gs its only common sense to come to a conclusion what a 1.6 palio with its superior Power to weight ratio would be experiencing. Definitely more than .5 Gs

The peak yellow points are the higher end of positive Gs under acceleration. So every time the yellow line reaches its peak and folds down, its the car decelerating. There is no way to do any corner identification since you could just be decelerating down the straight for no reason and that too would show a drop of the yellow curve.

Again, this is just something that I thought of after breaking my head over the graph for quite some time. So please do not take off on me. I am as keen as anyone to actually know what it truly means.

Last edited by aah78 : 7th April 2009 at 01:49. Reason: Quote fixed.
petrol_head is offline  
Old 6th April 2009, 23:38   #82
Senior - BHPian
 
iceman91's Avatar
 
Join Date: Nov 2004
Location: melbourne/banga
Posts: 1,961
Thanked: 34 Times

well done on the effort petrol head..I have no idea about this myself so cannot comment on whether you are right or wrong
iceman91 is offline  
Old 6th April 2009, 23:50   #83
BHPian
 
d3mon's Avatar
 
Join Date: Nov 2008
Location: Bangalore
Posts: 915
Thanked: 4,096 Times

I'm afraid you have got it wrong there, petrol head.

In the second graph, the yellow line is the lateral G force. If it's in the middle, the car is going straight(0G), if it's positive, it implies the car is turning left, and if it's negative, the car is turning right.

The red line denotes the longitudinal acceleration. If the car is travelling at a constant speed, the red line will be in the middle, if the car is accelerating, the red line will be above the 0G line, and if it's braking, the line will fall below the 0G mark.

Hence, analyzing the curves, it seems the palio was driven by a kamikaze driver, who did not take his foot off the brake all the way through(red line is below 0G throughout) , and was constantly turning left or right (yellow line is rarely close to 0G)

This, khan_sultan, is the only possible inference one can draw from that curve.

But as you have mentioned that the iPhone was held in someone's hand, the results are expected to be meaningless.

Cheers!

PS: No offence to anyone, but what is so difficult about interpreting those graphs? The axes and the curves are clearly marked on the graph itself !

Last edited by d3mon : 6th April 2009 at 23:59.
d3mon is offline  
Old 7th April 2009, 00:06   #84
BANNED
 
mclaren1885's Avatar
 
Join Date: Jul 2005
Location: Bangalore (the city of modded cars) !!
Posts: 4,820
Thanked: 45 Times
Infractions: 0/1 (10)

Binoy thanks a ton for that video. Mohnish, actually the car was handling way way better than with stock tires with the AD07's in the front. Ideally if it ran AD07's on all 4 it would have been brilliant to drive the car around track and put in some quick laps. That said, the car was a brilliant experience to drive and probably it had a lot more potential than what was displayed due to limitations of tires and suspension. Anyways, its a good benchmark for you to improve on and atleast you figured out what you need to work on asap.
mclaren1885 is offline  
Old 7th April 2009, 00:12   #85
BHPian
 
petrol_head's Avatar
 
Join Date: Mar 2009
Location: Madras
Posts: 234
Thanked: 60 Times

@ demon

thanks dude actually now it seems to make more sense. As you said, the yellow curve denotes left and right turns with the yellow line being constant on the o point stating that the car is moving straight. When the yellow curve moves higher it refers to the intensity of the turns to the left and when the yellow line drops below the 0 line, it denotes the intensity of the turns taken to the right. It makes sense that there are more indications of heavier and more intense right turns since its a clockwise circuit having more right hand corners.

As far as the red curve goes, I guess the curve should be a little higher and must fluctuate above and below the 0 G line indicating both positive and negative Gs while accelerating and decelerating respectively. Here the red line seems to be only denoting negative Gs as the curve does not go anywhere above the 0 G line.

I think I got the reasoning for the first graph right but the numbers projected are impossible.

PS: I am not an engineer. Neither did I ever have any inclination towards graphs and figures. So if my terminology or explanations were incorrect anywhere, kindly excuse me. I was only trying my best to put across what I could understand from these black boards with colored wriggling snakes on them.

Last edited by petrol_head : 7th April 2009 at 00:19.
petrol_head is offline  
Old 7th April 2009, 01:09   #86
Senior - BHPian
 
Shan2nu's Avatar
 
Join Date: Feb 2004
Location: Hubli - Karnata
Posts: 5,533
Thanked: 125 Times

Quote:
actually the car was handling way way better than with stock tires with the AD07's in the front. Ideally if it ran AD07's on all 4 it would have been brilliant to drive the car around track and put in some quick laps.
Were you running AD's at front in the vid coz there seemed to be a vast diff between front and rear grip levels.

Shan2nu
Shan2nu is offline  
Old 7th April 2009, 01:19   #87
BANNED
 
mclaren1885's Avatar
 
Join Date: Jul 2005
Location: Bangalore (the city of modded cars) !!
Posts: 4,820
Thanked: 45 Times
Infractions: 0/1 (10)

Quote:
Originally Posted by Shan2nu View Post
Were you running AD's at front in the vid coz there seemed to be a vast diff between front and rear grip levels.

Shan2nu
Yeah. The AD's were running in the front and stock tires on the rear. Front end had awesome grip but the rear was on tenter hooks ready to unleash the minute you steered in a bit too hard. Personally, I kind of liked this setup. But one has to know the limits, like I just did after I spun out.
mclaren1885 is offline  
Old 7th April 2009, 08:21   #88
BANNED
 
Join Date: Nov 2004
Location: Bangalore / Madras
Posts: 1,982
Thanked: 31 Times

Quote:
Originally Posted by iceman91 View Post
no the phone was held in hrag's hands
As a Senior BHPian, I did a pretty good job of holding it steady. I'm sure a Distinguished BHPian would have held it better (the phone, that is). Moderators know how to really mount it.
hrag is offline  
Old 7th April 2009, 10:16   #89
Senior - BHPian
 
supremeBaleno's Avatar
 
Join Date: Dec 2005
Location: Chennai / Kochi
Posts: 5,546
Thanked: 2,698 Times

Real nice pictures there, madan98.3 and others.

It was hot and if slipstream had not turned up at my place as promised, I would have stayed home in a/c comfort. But once at the track, it was fun as usual. At each track day, I think of riding shotgun with someone, but could never gather the courage for the same.

This time around, I somehow willed myself into a ride in manek's 5-speed M800 and the way he was pushing the car, I had serious thoughts of asking him to 'pleeaaase' let me get off after the 1st lap. But after a lap, I resigned myself to whatever fate had in store for me and decided to enjoy the drive. It was fun, but there were moments when my mind would wander off thinking 'what if a tyre blows up' or 'will the car topple'. I timed manek at 2:35, which is not bad for an M800 I guess.

Then a drive with nitrous on his Esteem. Our guy, as usual, was careful in his driving and being a low car than M800, felt more safer. Just once he made a mistake and to me it felt like a shorter version of the 'close-miss' I had with my car on the IT corridor long ago. Ofcourse, the car was back in control and all was fine. Timed him at 2:30 - could have been better if not for the mistake he made which lost some time.

Some pictures from my cam.

1) The Man:
TRACK DAY? P & P Report-dsc02072.jpg

2) And his Mistress:
TRACK DAY? P & P Report-dsc02033.jpg

3) And the man among cars. Did look real mean.
TRACK DAY? P & P Report-dsc02074.jpg

4) The Audi - loved it.
TRACK DAY? P & P Report-dsc02043.jpg

5) The vRS
TRACK DAY? P & P Report-dsc02076.jpg

6) The awesome Elantra
TRACK DAY? P & P Report-dsc02062.jpg


7) Another shot of the Elantra
TRACK DAY? P & P Report-dsc02050.jpg

8) Yet another
TRACK DAY? P & P Report-dsc02059.jpg

9) v1p3r's Swift-D ???
TRACK DAY? P & P Report-dsc02063.jpg

10) The next gen racers :
TRACK DAY? P & P Report-dsc02079.jpg
supremeBaleno is offline  
Old 7th April 2009, 10:51   #90
Senior - BHPian
 
iceman91's Avatar
 
Join Date: Nov 2004
Location: melbourne/banga
Posts: 1,961
Thanked: 34 Times
Some more pics

Some more pictures taken by Binoy, on the way to the track and at the track
Attached Thumbnails
TRACK DAY? P & P Report-mmst-iceman.jpg  

TRACK DAY? P & P Report-mmst-shahnavaz.jpg  

TRACK DAY? P & P Report-mmst-vikram.jpg  

TRACK DAY? P & P Report-sid.jpg  

TRACK DAY? P & P Report-mmst-ice.jpg  

TRACK DAY? P & P Report-mmst-me.jpg  

TRACK DAY? P & P Report-awaiting-130pm.jpg  

TRACK DAY? P & P Report-lol.jpg  

iceman91 is offline  
Closed Thread

Most Viewed


Copyright ©2000 - 2024, Team-BHP.com
Proudly powered by E2E Networks