Team-BHP > The Indian Car Scene
Register New Topics New Posts Top Thanked Team-BHP FAQ


Reply
  Search this Thread
91,338 views
Old 9th August 2016, 15:52   #1
BHPian
 
slamnos's Avatar
 
Join Date: Mar 2007
Location: Bangalore
Posts: 202
Thanked: 521 Times
City-wise Car Sales in India : April 2015 - March 2016

Hello Guys,

Sharing with you the Citywise Car Sales Analysis for the financial year 2015 (Apr '15 to Mar '16)

This time though I have included additional analysis which you might find interesting.

I will be covering the following data in this post:

> Zone wise market share
> Top 10 States contributing to car sales (New)
> Top 10 Cities contributing to car sales
> Segment-wise Top 10 cities
> Top 10 cities growth v/s last year
> Brand-wise city market share (New)

Starting with Zone-wise sales, nothing much has changed since last year except slight decrease in North zone (I believe it is due to ban on 2000 cc and above Diesel vehicles)

Name:  Zonewise.png
Views: 43177
Size:  150.1 KB

Top 10 States contributing to car sales:

This is a new addition in this year's post, this gives a perspective of how in some states, a cluster of small towns can outperform states which house big metropolitan

City-wise Car Sales in India : April 2015 - March 2016-statewise.png

KINDLY NOTE: The subsequent Bar charts are color coded for easier understanding of data, kindly refer below graph for color coding

Name:  Chart Color.png
Views: 42606
Size:  135.2 KB

KINDLY NOTE: In all of the below data following cities have been clustered for easier understanding & hence
Delhi contains : Delhi + Noida + Gurgaon + Faridabad + Ghaziabad
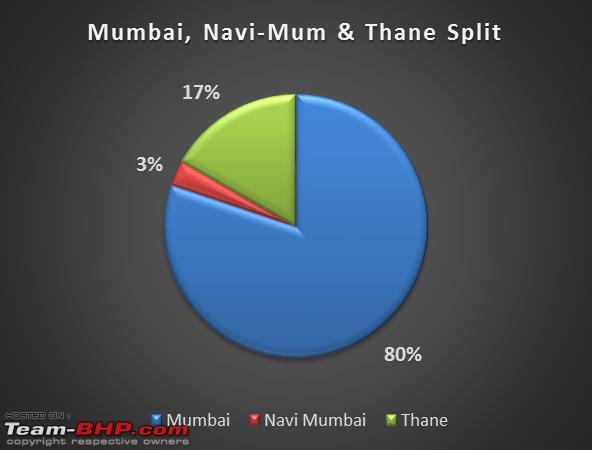
Mumbai contains : Mumbai + Thane + Navi-Mumbai
Hyderabad contains : Hyderabad + Secunderabad
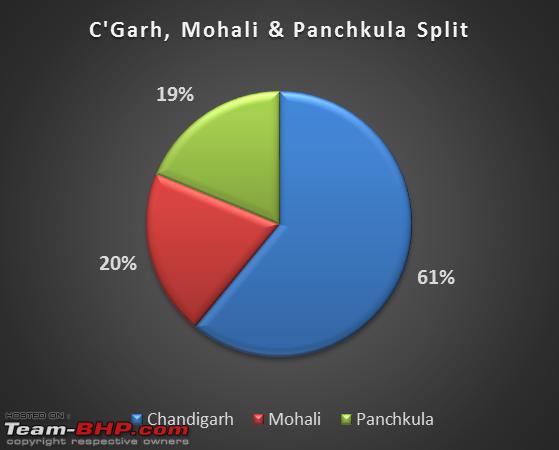
Chandigarh contains : Chandigarh + Mohali + Panchkula

Top 10 Cities contributing to Car Sales

Key Highlights:
> Bangalore pips Mumbai to become the second largest car market in FY-15
> Jaipur Swaps rank with Kolkata, now ranks 8th
> Cochin loses its spot to Lucknow in Top 10 Cities

City-wise Car Sales in India : April 2015 - March 2016-citywise-top10.png

Following table gives you list of Top 25 cities in sales volume & their contribution

City-wise Car Sales in India : April 2015 - March 2016-top-25.jpg

Segment-wise Top 10 cities

Low Hatch Segment

City-wise Car Sales in India : April 2015 - March 2016-low-hatch.png

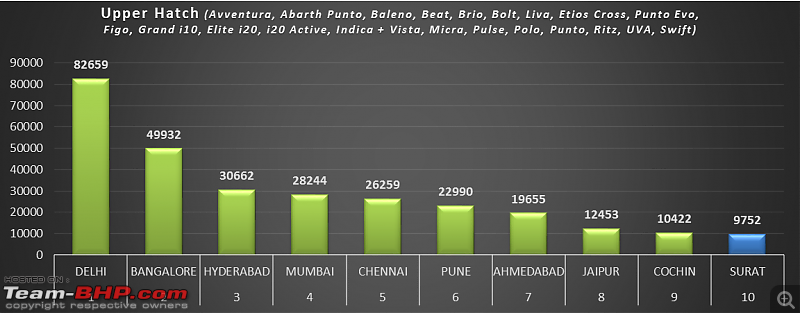
Upper Hatch Segment

City-wise Car Sales in India : April 2015 - March 2016-upper-hatch.png

Sub-4 Meter Sedan Segment

City-wise Car Sales in India : April 2015 - March 2016-sub4-sedan.png

Low Sedan Segment

City-wise Car Sales in India : April 2015 - March 2016-low-sedan.png

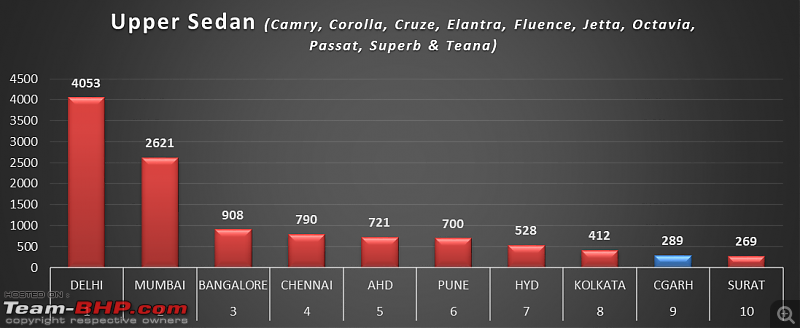
Upper Sedan Segment

City-wise Car Sales in India : April 2015 - March 2016-upper-sedan.png

MPV Segment

City-wise Car Sales in India : April 2015 - March 2016-mpv.png

Cross Over Segment

City-wise Car Sales in India : April 2015 - March 2016-cross-overs.png

Lower SUV Segment

City-wise Car Sales in India : April 2015 - March 2016-low-suv.png

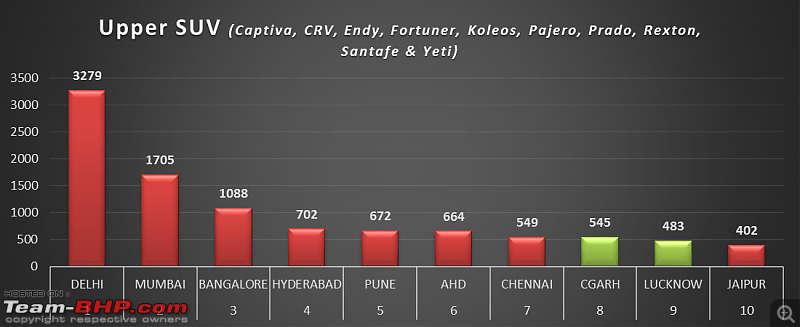
Upper SUV Segment

City-wise Car Sales in India : April 2015 - March 2016-upper-suv.png

Key Highlights: All segments with bigger engines (Upper Sedan, MPV, Low SUV, Upper SUV) are going down in most top cities. Government are you reading this!

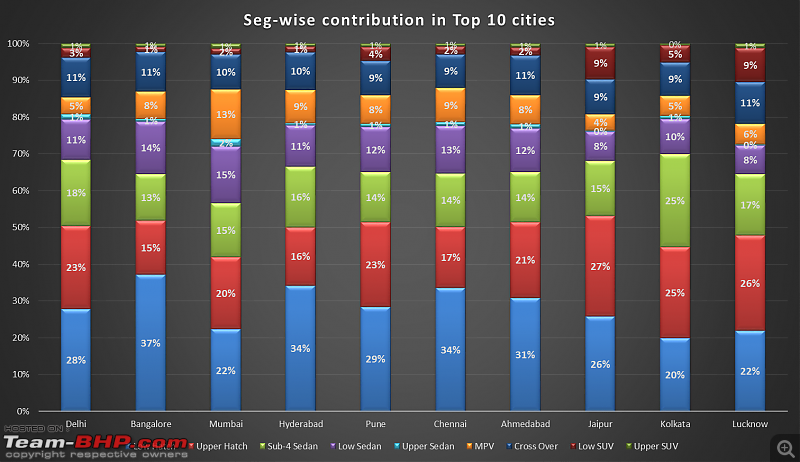
Following Chart shows what segment-wise contribution in each of the Top 10 cities

City-wise Car Sales in India : April 2015 - March 2016-segwise-city-contr.png

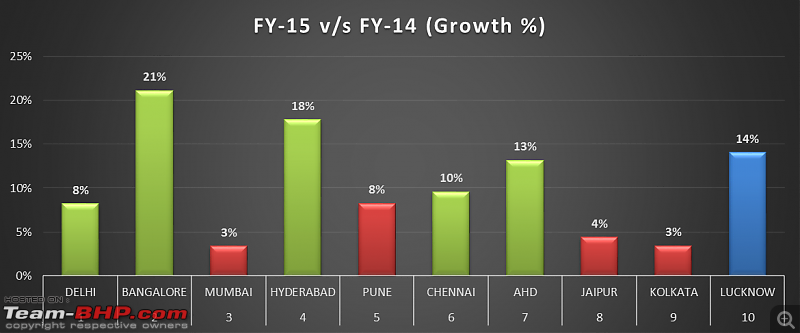
Top 10 cities growth v/s last year

City-wise Car Sales in India : April 2015 - March 2016-growth.png

Bangalore & Hyderabad seems to be growing in a rampant rate (already their base volumes are high enough)

Brand-wise city market share

Following Data shows how each Brand's (Manufacturer) market share against PAN India average.

This gives a perspective of which Brands are performing better/poor in each of these Top 10 cities compared to others.

NOTE
Red Cells denote lower brand share compared to PAN India average
Green Cells denote higher brand share compared to PAN India average
Orange Cells denote equal share

Delhi

City-wise Car Sales in India : April 2015 - March 2016-delhi-revised.jpg

Bangalore

City-wise Car Sales in India : April 2015 - March 2016-bbangalore.jpg

Mumbai

City-wise Car Sales in India : April 2015 - March 2016-mumbai-revised.jpg

Hyderabad

City-wise Car Sales in India : April 2015 - March 2016-hyd-revised.jpg

Pune

City-wise Car Sales in India : April 2015 - March 2016-bpune.jpg

Chennai

City-wise Car Sales in India : April 2015 - March 2016-bchennai.jpg

Ahmadabad

City-wise Car Sales in India : April 2015 - March 2016-bahd.jpg

Jaipur

City-wise Car Sales in India : April 2015 - March 2016-bjai.jpg

Kolkata

City-wise Car Sales in India : April 2015 - March 2016-bkol.jpg

Lucknow

City-wise Car Sales in India : April 2015 - March 2016-bluck.jpg

To give you a better understanding of split up of cluster cities please refer to charts below

Delhi + NCR

Name:  Delhi Split.png
Views: 38046
Size:  153.1 KB

Mumbai, Thane & Navi-Mumbai

Name:  Mumbai Split.png
Views: 38033
Size:  139.0 KB

Hyderabad & Secunderabad

Name:  Hyd Split.png
Views: 37855
Size:  112.4 KB

Chandigarh, Mohali & Panchkula

Name:  Chandigarh Split.png
Views: 37998
Size:  136.4 KB

Thank you for reading, hope this thread was informative.

If you need any other specific data kindly post in this thread, I shall try and fetch if available

Last edited by Aditya : 17th August 2016 at 22:42. Reason: Error in image, will be reuploaded
slamnos is offline   (129) Thanks
Old 9th August 2016, 16:25   #2
BANNED
 
Join Date: Apr 2015
Location: Kochi
Posts: 924
Thanked: 7,279 Times
re: City-wise Car Sales in India : April 2015 - March 2016

This chart can be used to improve the transport infrastructure of the top 25 cities at priority basis, as these cities are going to have similar vehicle growth in the coming years. The top 25 contributes to more than 50% sales and I'm sure the population would be around 10 or 15 % of the total population. This disproprortionate sales will choke these cities in another decade if the public transport doesn't gets revamped altogether. Is anyone listening at all is the big question?

Last edited by GTO : 11th August 2016 at 13:00. Reason: Typo
The Rationalist is offline   (11) Thanks
Old 9th August 2016, 17:22   #3
Senior - BHPian
 
KiloAlpha's Avatar
 
Join Date: Mar 2010
Location: Cubicle
Posts: 1,605
Thanked: 3,002 Times
re: City-wise Car Sales in India : April 2015 - March 2016

Thanks for this @Slamnos, very useful stats.

What I find interesting is that Maruti is performing poorly (in terms of market share) in most of the large cities when compared to their pan-India market share. For example, in Mumbai, Maruti has 31% market share; in Bangalore 36%.
Which probably means that, in B & C category towns, Maruti rules the roost. And other brands like Ford, VW, Renault, etc have little to no presence.
KiloAlpha is offline   (8) Thanks
Old 10th August 2016, 08:33   #4
Distinguished - BHPian
 
paragsachania's Avatar
 
Join Date: Nov 2007
Location: Belur/Bangalore
Posts: 7,148
Thanked: 27,140 Times
re: City-wise Car Sales in India : April 2015 - March 2016

Lovely thread yet again this year slamnos. Always interesting to see What is sold, where is it sold, how much they sell and all these reasons contribute to why we rant about traffic in city or while driving on highways in few states!

Here are some of the interesting points from the data you published:
  • The total car sold in Top 25 Cities is 1375918

  • NCR has the largest share with 21.49% of cars sold among the 25 cities

  • Maharashtra alone accounts for 16.79% of this share among 25 cities from Mumbai, Pune & Nagpur

  • Karnataka is at the 4th spot with 10% and cars sold 9.76% is the share from Bangalore alone (134289 cars)of the total share of 25 cities which is higher by 1.42% from its immediate predecessor Gujarat that accounts for 8.34% from 3 cities of Ahmedabad, Vadodara and Surat combined with 114817 cars

  • State wise after NCR, Maharashtra and Gujarat account for highest number of cars sold coming from 6 cities from these 2 states - Ahmedabad, Surat, Vadodara, Mumbai, Pune, Nagpur - This is 25.14% together from these 6 cities while Delhi/NCR alone stands at 21.49%

  • Interestingly the city wise data also tells us why we rant so much about Bangalore traffic - There has been no other city from the state of Karnataka in top 25 (Mangalore, Mysore, Hubli-Dharwad, Belgaum etc)

  • If one looks at the top 25 cities 3 from Maharashtra fares like this :1st is Mumbai (54%) followed by Pune (35%) with Nagpur at 3rd spot buying 11% of the total cars sold from these 3 cities together

  • 2 Cities from Tamil Nadu in top 25 are Chennai and Coimbatore. Chennai bought 77% cars while Coimbatore at 33%

  • Among 3 top Cities In Kerala, Trivandrum being the state capital contributed just the least at 28% while Kochi stood 1st at 41% followed by Calicut at 32%

  • Among the top 10 cities, Pune is the only Non-State capital in the list at 5th spot

  • Highest selling states are Maharashtra, UP and Gujarat although Karnataka stands 4th, Bangalore alone that has 70% of the share from all new cars sold across Karnataka

Further more, how cities fare within their own states:
  • Of the total cars sold in Maharashtra (333394), 69% comes from Mumbai-Pune-Nagpur (231067)

  • Of the total cars sold in Gujarat (199023) - 58% comes from Ahmedabad-Vadodara-Surat (114817)

  • Of the total cars sold in Karnataka (197956) - 68% comes from Bangalore alone (134289)

  • Of the total cars sold in Kerala (181815) - 49% comes from Kochi-Calicut-Trivandrum (89687)

  • Of the total cars sold in Tamil Nadu (170048) - 60% comes from Chennai-Coimbatore alone (102187)

Last edited by paragsachania : 10th August 2016 at 08:54.
paragsachania is offline   (19) Thanks
Old 10th August 2016, 09:59   #5
BHPian
 
slamnos's Avatar
 
Join Date: Mar 2007
Location: Bangalore
Posts: 202
Thanked: 521 Times
re: City-wise Car Sales in India : April 2015 - March 2016

Quote:
Originally Posted by The Rationalist View Post
This chart can be used to improve the transport infrastructure of the top 25 cities at priority basis, as these cities will be going to have similar vehicle growth in the coming years.
Absolutely, actually the RTO will even be having regionwise data in a particular city too but the Government fails to do anything. However its high time city planners start acting before other towns replicate the issues faced in cities like Bangalore & Mumbai

Quote:
Originally Posted by KiloAlpha View Post
What I find interesting is that Maruti is performing poorly (in terms of market share) in most of the large cities when compared to their pan-India market share. For example, in Mumbai, Maruti has 31% market share; in Bangalore 36%.
Which probably means that, in B & C category towns, Maruti rules the roost. And other brands like Ford, VW, Renault, etc have little to no presence.
Yes, Similar trend can be found with brands like Tata & Mahindra, also there is a perception of high maintenance cost associated with global brands & hence Tier-3 & below generally play safe with Indian manufacturers.

And for manufacturers doing low volumes like Fiat, Mitsubishi etc, dealers have a strong role to play in certain towns as well. Dealers with good A.S.S have resulted in much better sales than the manufacturer himself doing advert campaigns.
slamnos is offline   (5) Thanks
Old 10th August 2016, 10:26   #6
BHPian
 
slamnos's Avatar
 
Join Date: Mar 2007
Location: Bangalore
Posts: 202
Thanked: 521 Times

Below Table shows the Top 10 Models sold in the Top 10 cities, also have included PAN India Top 10 for reference, interesting to see the preference in each city

City-wise Car Sales in India : April 2015 - March 2016-top-10-cars-top-10-cities.png

Last edited by Vid6639 : 13th August 2016 at 16:08. Reason: as per request.
slamnos is offline   (16) Thanks
Old 10th August 2016, 10:51   #7
Senior - BHPian
 
vibbs's Avatar
 
Join Date: Feb 2011
Location: SG
Posts: 1,125
Thanked: 2,297 Times
re: City-wise Car Sales in India : April 2015 - March 2016

Nice and comprehensive analysis. Amazed at how Delhi NCR is way ahead compared to all other cities. I believe the better network of roads (atleast within Delhi) do contribute to some of this.


BTW you may want to redo the colour formatting of the quoted table. Even Number rows are not visible due to colour.

Quote:
Originally Posted by slamnos View Post
Hello Guys,


Following table gives you list of Top 25 cities in sales volume & their contribution

Attachment 1540067
EDIT: Oops Just saw it has already been editted.

Quote:
Originally Posted by paragsachania View Post
[*]Among 3 top Cities In Kerala, Trivandrum being the state capital contributed just the least at 28% while Kochi stood 1st at 41% followed by Calicut at 32%
One more interesting thing is despite not having any city in the top 10, Kerala still figures at number 6 among the states with a 7% share. It is also the smallest and least populated state in the top 10 list.

Last edited by vibbs : 10th August 2016 at 10:59.
vibbs is offline   (1) Thanks
Old 10th August 2016, 11:32   #8
BHPian
 
The Adventurer's Avatar
 
Join Date: Jul 2014
Location: Kochi
Posts: 48
Thanked: 56 Times
re: City-wise Car Sales in India : April 2015 - March 2016

Quote:
Originally Posted by vibbs View Post

One more interesting thing is despite not having any city in the top 10, Kerala still figures at number 6 among the states with a 7% share. It is also the smallest and least populated state in the top 10 list.
It's increasingly common these days to have multiple cars in rural middle class nuclear families in Kerala.

Last edited by GTO : 11th August 2016 at 13:01. Reason: Typo
The Adventurer is offline  
Old 10th August 2016, 11:37   #9
BHPian
 
Join Date: May 2016
Location: Pune
Posts: 425
Thanked: 1,019 Times
re: City-wise Car Sales in India : April 2015 - March 2016

Quote:
Originally Posted by slamnos View Post
Below Table shows the Top 10 Models sold in the Top 10 cities, also have included PAN India Top 10 for reference, interesting to see the preference in each city

Attachment 1540222
No Alto in Top 10 models for Mumbai.

Wagon-R is the first choice for Tier-1 cities, lot better than Alto in terms of space and practicality.

Ertiga, City, Creta, Ciaz - now these are cars greater than 4m and featuring in Top 10 for Mumbai. Mumbaikars seem to have climbed the ladder to better lifestyle and the choice of car shows it.
varunswnt is offline   (3) Thanks
Old 10th August 2016, 11:52   #10
BHPian
 
Join Date: Nov 2007
Location: Bangalore
Posts: 941
Thanked: 1,448 Times
re: City-wise Car Sales in India : April 2015 - March 2016

Very well done! Thanks for sharing these stats. Quite interesting to note that Bangalore, being a standalone city, makes up for a large part of these sales.

As someone suggested, maybe these can be used to figure out what type of infrastructure the cities need to plan for accommodating the future growth including public transport infrastructure.
Mad Max is offline   (2) Thanks
Old 10th August 2016, 12:11   #11
BHPian
 
slamnos's Avatar
 
Join Date: Mar 2007
Location: Bangalore
Posts: 202
Thanked: 521 Times
re: City-wise Car Sales in India : April 2015 - March 2016

Quote:
Originally Posted by Mad Max View Post
Very well done! Thanks for sharing these stats. Quite interesting to note that Bangalore, being a standalone city, makes up for a large part of these sales.
Bangalore comes close to Delhi (stand alone city) in many segments , but when combined with NCR the Gap increases.

However going by the growth rate of Bangalore it might leap ahead of Delhi (Not NCR combined) in coming years.
slamnos is offline   (1) Thanks
Old 10th August 2016, 13:03   #12
Distinguished - BHPian
 
paragsachania's Avatar
 
Join Date: Nov 2007
Location: Belur/Bangalore
Posts: 7,148
Thanked: 27,140 Times
re: City-wise Car Sales in India : April 2015 - March 2016

Quote:
Originally Posted by slamnos View Post
However going by the growth rate of Bangalore it might leap ahead of Delhi (Not NCR combined) in coming years.
And that for me is an alarming trend to be honest.

Look at how traffic on some of the faster sections has increased in the past 2 years alone. Been discussing this on multiple other threads - Bangalore needs another partner to take the load within the state.

The list is a proof that no other city from Karnataka even comes in Top 25 Cities.
paragsachania is offline   (4) Thanks
Old 10th August 2016, 13:12   #13
Senior - BHPian
 
Latheesh's Avatar
 
Join Date: Dec 2007
Location: CNN/BLR
Posts: 4,243
Thanked: 10,091 Times
re: City-wise Car Sales in India : April 2015 - March 2016

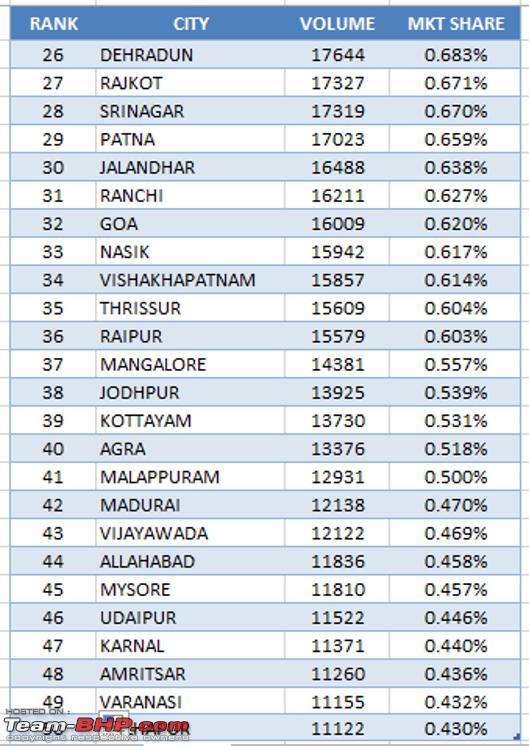
@slamnos - Thank you for the detailed analysis. Could you please share top 50 (1-25 already available, would like to see 26-50) city wise sales figures, if you have?

Last edited by Latheesh : 10th August 2016 at 13:14.
Latheesh is online now  
Old 10th August 2016, 14:09   #14
BHPian
 
slamnos's Avatar
 
Join Date: Mar 2007
Location: Bangalore
Posts: 202
Thanked: 521 Times
re: City-wise Car Sales in India : April 2015 - March 2016

Quote:
Originally Posted by Latheesh View Post
@slamnos - Thank you for the detailed analysis. Could you please share top 50 (1-25 already available, would like to see 26-50) city wise sales figures, if you have?
Sure, here you go!

Name:  26 to 50.png
Views: 42439
Size:  281.0 KB

Last edited by slamnos : 10th August 2016 at 14:39.
slamnos is offline   (10) Thanks
Old 10th August 2016, 14:17   #15
BHPian
 
Join Date: Jul 2010
Location: Chennai
Posts: 171
Thanked: 116 Times
re: City-wise Car Sales in India : April 2015 - March 2016

Appreciate the effort and time put in to prepare such a detailed report.

How GST would affect the body styles and overall vehicle sales in the same cities would really intriguing.
rajess_in is offline  
Reply

Most Viewed


Copyright ©2000 - 2024, Team-BHP.com
Proudly powered by E2E Networks