Team-BHP
(
https://www.team-bhp.com/forum/)
Quote:
Originally Posted by inder
(Post 3960162)
As stated earlier these are my high risk investments. Still should it be avoided?
|
You need to decide what kind of risk appetite you can stomach for what kind of returns.
For instance DSPBR Micro Cap lost over 60% in 2008, your Rs. 1.5 lakh would have been worth around Rs. 50,000 by the end of the year if you invested solely in this fund. Depending on when you put in the lump-sum, it would have taken you around 3-5 years to get back to your original Rs. 1.5 lakh. Is this acceptable to you?
Don't get me wrong, DSPBR Microcap is a great fund, it just may not be suited for a beginner with no corpus.
I suggest you spend some time on sites like Value Research to decide on your approach before you plunge into MFs.
Quote:
Originally Posted by inder
(Post 3960012)
Ok After a lot of internet hours I have zeroed on the following three funds (not in any particular order)
1) Mirae Asset Emerging Bluechip
2)DSP Blackrock Microcap
3) Franklin India Smaller companies.
I intend to invest in them lumsum. Approx 50k each to start with. These are supposed to be my high risk investments, I intend to keep them for 3-5 yrs.
Also I have a demat account with motilal oswal, but I want to invest directly in the MF's. Is it possible to do so without opening a demat for MF's. Shall Karvy etc also charge me commission for direct plans. Mirae does not have an office in my city. Their toll free is a waste.( no one answers) Which makes me skeptical of Mirae. I dont have net banking so cant purchase the funds online. Please advice
|
When you say "high risk investments", are you ready to lose the complete investment? If yes, then you are fine.
As others have suggested, it might be better to do investments via SIP in the current market.
So, with 50 + 50 + 50 K = 150 K, you might want to do 10K SIP split across the three funds of your choice (4K + 3K + 3K per month). This would total up to 120K at the end of the year.
BTW: Franklin India Smaller companies has been my favourite.
With the remaining 30K you could invest in lump sum (or split it further and then invest) when the markets fall. Even better, if you have the time to research, you might want to buy some shares with your existing demat account.
Many believe that the outlook for 2016 is not very positive. 2014 was awesome.
I expect very less growth until mid of 2017 - just hope that the -10% from last year is offset by end of this year.
I would be happy if I am wrong.
Quote:
Originally Posted by inder
(Post 3960162)
As stated earlier these are my high risk investments. Still should it be avoided?
|
Inder - most replies to your posts are spot on. Do not go for only smallcaps and midcap funds as they can be quite volatile. As a beginner, it is much better to invest in one Large Cap oriented fund (likely to be less volatile) and perhaps another Diversified equity Fund (to get a small taste of midcaps and smallcaps).
Also lumpsum purchase/investment is a big risk. Please take the SIP route.
If you are unable to decide on which fund to invest in, you can get some idea based on the CRISIL ranking of mutual funds - which they release after every quarter's performance. This document is small and easy to follow for new MF investors. And it gives a reasonable picture of what to expect from each fund. It has worked well for me for the past 6-7 years.
I'm attaching the CRISIL mutual fund ranking booklet for the past 3 quarters (the same can be downloaded from CRISIL website as well). Hope you (& others) find it useful.
CRISIL-Mutual-Fund-Ranking-Booklet-June2015.pdf CRISIL-Mutual-Fund-Ranking-Booklet-Sept2015.pdf CRISIL-Mutual-Fund-Ranking-Booklet-Dec2015.pdf
Invest wise & wish you many safe miles.
Thanks for the advice guys. I think I will choose only one fund from the list now, and search for one in Large cap and one in diversified. Also will take the SIP route.
Hi,
Do some research on equity multi-cap, ICICI Prudential Value Discovery Fund.
Returns over the years:
1 year: 3.31
3-year: 27.36
5-year: 17.59
10-year: 15.29
A fund that has given returns of 15.20 over 10 years should be able to weather some bad years years also.
The worst year has been 2008 where it gave returns of -54.56%, but then the S&P BSE 500 gave a return of -58.14% in the same year and equity multi-caps in general gave returns of -52%.
Your research must include how the fund fared in 2008 and 2011. These were the years when the stock markets did very badly in the recent past.
Pradeep
Quote:
Originally Posted by inder
(Post 3960936)
Thanks for the advice guys. I think I will choose only one fund from the list now, and search for one in Large cap and one in diversified. Also will take the SIP route.
|
Quote:
Originally Posted by pradkumar
(Post 3961306)
ICICI Prudential Value Discovery Fund.
Returns over the years:
1 year: 3.31
3-year: 27.36
5-year: 17.59
10-year: 15.29
|
Until April 15 2014, this fund was called "Discovery Fund" and it invested primarily in mid and small caps and was categorized as a mid-cap fund. After changing its name to "Value Discovery Fund", it now invests predominantly in large caps and is now categorized as a multi-cap fund.
It is the best performing multi-cap fund based on its 3/5/10-year historical performance, but that has everything to do with the change in categorization. Going forward, one cannot expect those outsized historical returns and even if you look at the last year, its returns are now in line with other top-performing multi-cap and large-cap funds.
It is a great disservice to other funds that VR and others have simply re-categorized this fund instead of suspending its star rating until there is enough historic data like they do with other funds.
Is there a believer of Downside / Capture Ratios in here when it comes to comparing Mutual Funds?
If yes, question is that when it comes to benchmark, different funds have different benchmark depending on how they are allocating the assets. Would it be wise to stick to one benchmark and compare all funds (say large cap) to that one benchmark or compare each mutual fund with the benchmark that suits it as per allocation strategy?
Quote:
Originally Posted by fine69
(Post 3962491)
Is there a believer of Downside / Capture Ratios in here when it comes to comparing Mutual Funds?
If yes, question is that when it comes to benchmark, different funds have different benchmark depending on how they are allocating the assets. Would it be wise to stick to one benchmark and compare all funds (say large cap) to that one benchmark or compare each mutual fund with the benchmark that suits it as per allocation strategy?
|
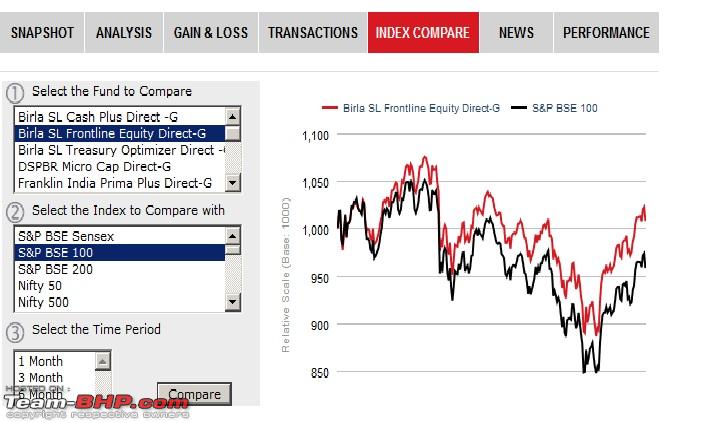
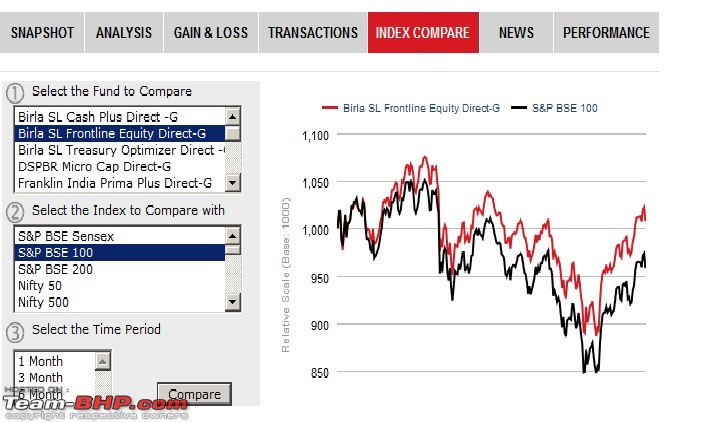
Yes I believe in downside protection ratios a little more that in upside capture potential. Use VR or Morning Star (X-Ray Tool) to determine the portfolio constitution for eg. Birla Sunlife Frontline and SBI Magnum Equity have a fair bit of commonality. For large caps my personal benchmark is the the S&P BSE 100 since that most closely mirrors large caps. Thus for each category sift for a benchmark that reflects your funds. Its a fair bit of work but then its extremely hard earned money
Quote:
Originally Posted by shady_lawyer
(Post 3962571)
Yes I believe in downside protection ratios a little more that in upside capture potential.
|
You mind sharing the calculator that you are using for calculating it. I downloaded one off of freefincal but its results aren't making sense.
Quote:
Originally Posted by fine69
(Post 3962583)
You mind sharing the calculator that you are using for calculating it. I downloaded one off of freefincal but its results aren't making sense.
|
I use the VR Index compare tool.
Quote:
Originally Posted by shady_lawyer
(Post 3962639)
I use the VR Index compare tool.
|
This gives the return comparison if I'm not wrong. I was looking for a calculator which can give me yearly downside / upside / overall capture ratios.
I think Ulcer Index (calculated on weekly basis instead of longer durations) and a combination of Downside / Capture ratios coupled with few more risk metrics should be enough to shortlist top 2-3 funds.
Quote:
Originally Posted by fine69
(Post 3962640)
This gives the return comparison if I'm not wrong. I was looking for a calculator which can give me yearly downside / upside / overall capture ratios.
|
Please use morning-star. @mods please excuse me for posting an external link.
e.g.-http://www.morningstar.in/mutualfunds/f0gbr06s9j/birla-sun-life-frontline-equity-fund-growth/risk-ratings.aspx
U.I. Calculator is found here:
simply download the historical NAV from the AMC website plug it in and you'll the U.I. Values.
http://investexcel.net/ulcer-index/
Quote:
Originally Posted by fine69
(Post 3962491)
Is there a believer of Downside / Capture Ratios in here when it comes to comparing Mutual Funds?
|
Personally I tend not to overanalyze and while I do look at a bunch of statistics, I try to remember that we are dealing with historic data and it has little relevance on the future. For instance I am hard-pressed to remember funds from 10 years ago that people still talk about.
@shady_lawyer has got good info for you. Morningstar is the best source for upside/downside capture ratios for those averse to MS Excel.
Quote:
Originally Posted by nowwhat?
(Post 3962660)
Personally I tend not to overanalyze and while I do look at a bunch of statistics, I try to remember that we are dealing with historic data and it has little relevance on the future. For instance I am hard-pressed to remember funds from 10 years ago that people still talk about.
@shady_lawyer has got good info for you. Morningstar is the best source for upside/downside capture ratios for those averse to MS Excel.
|
The problem with all these websites is there's room for a lot of questions. For example, why pick BSE 100 for upside/downside capture ratios even if the fund's allocation strategy doesn't follow this index.
Similarly, a lot of risk stats that exist as on date (say on valueresearch) have absolutely no meaning because the range of data which spans across 5-7-10 years suppresses a lot of 'out of control' situations (statistically speaking).
Then there was this interesting discussion on why high standard deviation is bad. People don't understand that (1) Std. dev. doesn't have a unit of measurement, its an absolute number (2) In silo, Stdev doesn't mean anything...anything at all! (3) Deviating from the benchmark is actually a very good thing till the time you are going above the benchmark.
Then today itself I posted on freefincal where the respected author was saying that a value of 0.33 of correlation between historic performance and future performance means that there's a good chance that any fund which has performed good in the past will perform well in future too.
This freefincal guy was somebody I was following for a while but such response made me a learned man. His posts on correlation totally contradict the fundamental rule of correlation i.e. it does not imply causation!
Having spent the last few days on a lot of other forums I realize that majority of the population is totally ill-informed. They think they are informed but they rely on measures to which they have absolutely no background.
I agree with you that a lot of people overanalyze things and mutual funds is one such area but the funny part is that they don't even understand half of the things that they are supporting or feeling good about.
In fact about a year ago I made exhaustive excels with daily data and calculated stats which majority might not have even heard of till these bloggers came about.
My point is, stick to the basics such as Ulcer Index or Capture ratios and there's a very very good chance that you'd end up with a fund that would most probably beat the index (simply because it did so earlier as well).
But then was it the fund or the fund manager or some other factor which doesn't have too much objectivity attached to it! :D
Quote:
Originally Posted by fine69
(Post 3962665)
The problem with all these websites is there's room for a lot of questions. For example, why pick BSE 100 for upside/downside capture ratios even if the fund's allocation strategy doesn't follow this index.
|
IIRC Morningstar compares upside/downside capture ratios against its corresponding index and also displays the category average.
Quote:
Originally Posted by fine69
(Post 3962665)
Similarly, a lot of risk stats that exist as on date (say on valueresearch) have absolutely no meaning because the range of data which spans across 5-7-10 years suppresses a lot of 'out of control' situations (statistically speaking).
|
Agree with you.
For instance, IDFC Premier Equity made some wrong bets in the run-up to the last general elections and its performance suddenly dipped. It took them some time to change direction and they were one of the first to invest heavily into SKS Microfinance, a move I thought was risky considering SKS had just come out of financial fraud. The fact is that all this is reflected in the statistics somewhere, for instance in the turnover ratio, but unless one knows causation the data on its own might make no sense.
Another example is Goldman Sachs Nifty Junior Bees, an index fund that mirrors the Next 50 index. Why does it have a high turnover ratio of 193%? I really don't know, especially as the underlying index is only supposed to change at most 5 stocks (10%) in its index each year.
Quote:
Originally Posted by fine69
(Post 3962665)
Then there was this interesting discussion on why high standard deviation is bad. People don't understand that (1) Std. dev. doesn't have a unit of measurement, its an absolute number (2) In silo, Stdev doesn't mean anything...anything at all! (3) Deviating from the benchmark is actually a very good thing till the time you are going above the benchmark.
|
Agree with you.
Quote:
Originally Posted by fine69
(Post 3962665)
This freefincal guy was somebody I was following for a while but such response made me a learned man. His posts on correlation totally contradict the fundamental rule of correlation i.e. it does not imply causation!
|
I too had my what-the-heck moment when I found out he invests in PPFAS, an outlier in the Indian mutual fund space. PPFAS believes in investing in parent companies in case valuations in the Indian markets are rich. For instance, they invest in Nestle S.A. instead of Nestle India. This totally belies some of the basics of investing especially that different markets behave differently and that subsidiaries may outperform their parents. Maruti Suzuki's market cap is higher than Suzuki's market cap in Japan.
Quote:
Originally Posted by fine69
(Post 3962665)
I agree with you that a lot of people overanalyze things and mutual funds is one such area but the funny part is that they don't even understand half of the things that they are supporting or feeling good about.
|
If you think the analysis of MFs is crazy, you should check out stocks. :)
Quote:
Originally Posted by fine69
(Post 3962665)
In fact about a year ago I made exhaustive excels with daily data and calculated stats which majority might not have even heard of till these bloggers came about.
|
Am curious to know what your findings are. You probably have much more skill and inclination for number-crunching than I do.
Quote:
Originally Posted by fine69
(Post 3962665)
But then was it the fund or the fund manager or some other factor which doesn't have too much objectivity attached to it!
|
This is the part that stays hidden. Fund Manager plays a big role, but the institutional role usually is not that well known. Because of all these and many other factors, I prefer to get my information by reading financial dailies and their analysis.
| All times are GMT +5.5. The time now is 12:04. | |