Team-BHP > Shifting gears
Register New Topics New Posts Top Thanked Team-BHP FAQ


Reply
  Search this Thread
49,174 views
Old 9th June 2022, 14:09   #61
BHPian
 
thehacker's Avatar
 
Join Date: Sep 2018
Location: Gurgaon / Patna
Posts: 39
Thanked: 124 Times
Re: The Technical Analysis, Futures & Options Thread

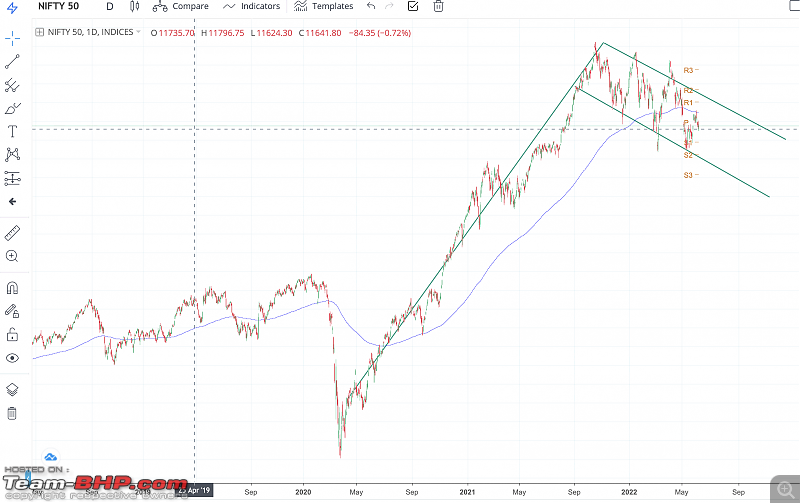
I am new to technical analysis. Correct me if I am wrong, but isn't Nifty50 forming a flag and pole pattern on daily chart?

The Technical Analysis, Futures & Options Thread-screenshot-20220609-2.05.34-pm.png

Now, whether it is bearish or bullish depends on the breakout that happens from the flag. However, if we just consider the flag channel, it is bearish and not sideways.
thehacker is offline  
Old 9th June 2022, 16:01   #62
BHPian
 
antz.bin's Avatar
 
Join Date: Aug 2011
Location: Pune
Posts: 986
Thanked: 3,888 Times
Re: The Technical Analysis, Futures & Options Thread

Quote:
Originally Posted by thehacker View Post
isn't Nifty50 forming a flag and pole pattern on daily chart?

Attachment 2318634
It kind of is, but it is also at support.

The Technical Analysis, Futures & Options Thread-screenshot-20220609-3.59.38-pm.png

The low risk trade at support is to buy. We buy with the hope that it will rise.
antz.bin is offline  
Old 9th June 2022, 16:04   #63
BHPian
 
deetee's Avatar
 
Join Date: Oct 2007
Location: Hyderabad
Posts: 485
Thanked: 1,593 Times
Re: The Technical Analysis, Futures & Options Thread

Quote:
Originally Posted by thehacker View Post
Now, whether it is bearish or bullish depends on the breakout that happens from the flag. However, if we just consider the flag channel, it is bearish and not sideways.
The flag you mentioned is indeed a solid channel that has been guiding the downward movement. As you said, it is bearish as well. That's all we can conclude confidently as of now.
I would say it is likely to breakdown, only if the present price action continues its decline.
Today there is strong bullish action but it is not accompanied by strong volumes, which makes me think that it will not hold (unless another day of strong momentum supports this).
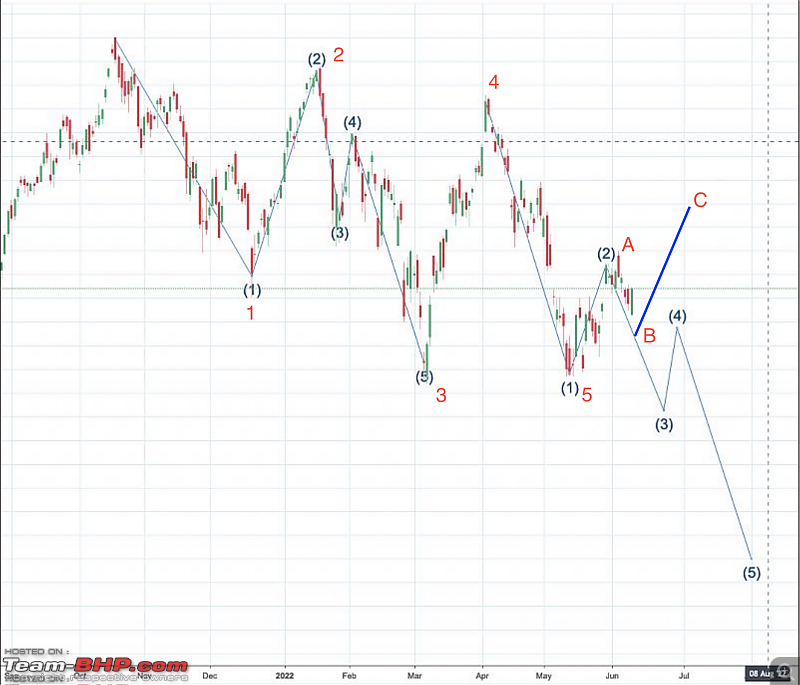
Applying Elliot waves, this is the movement I visualise for short term:
The Technical Analysis, Futures & Options Thread-screenshot-20220609-3.55.02-pm.png

And for medium term (couple of months), this is the macro movement I expect:
The Technical Analysis, Futures & Options Thread-screenshot-20220609-3.58.42-pm.png

Catch is that , extending lines into emptiness of chart is no better than speculation. Unless price action confirms, none of the above can hold true - but it is better to be prepared than to be surprised.
deetee is offline   (3) Thanks
Old 9th June 2022, 16:14   #64
BHPian
 
antz.bin's Avatar
 
Join Date: Aug 2011
Location: Pune
Posts: 986
Thanked: 3,888 Times
Re: The Technical Analysis, Futures & Options Thread

Quote:
Originally Posted by deetee View Post
Applying Elliot waves, this is the movement I visualise for short term:
Attachment 2318667

And for medium term (couple of months), this is the macro movement I expect:
Attachment 2318668

Catch is that , extending lines into emptiness of chart is no better than speculation. Unless price action confirms, none of the above can hold true - but it is better to be prepared than to be surprised.
Those Elliott waves don't look right. The 3 is supposed to be the most vigourous, and the ABC waves are missing.

Here. Fixed it.

The Technical Analysis, Futures & Options Thread-screenshot-20220609-4.08.41-pm.png

Last edited by antz.bin : 9th June 2022 at 16:15.
antz.bin is offline   (4) Thanks
Old 9th June 2022, 16:24   #65
BHPian
 
deetee's Avatar
 
Join Date: Oct 2007
Location: Hyderabad
Posts: 485
Thanked: 1,593 Times
Re: The Technical Analysis, Futures & Options Thread

Quote:
Originally Posted by antz.bin View Post
Those Elliott waves don't look right. The 3 is supposed to be the most vigourous, and the ABC waves are missing.

Here. Fixed it.

Attachment 2318673
Hey, that's at a slightly higher level than the one I drew. I do agree with your representation at that level. I skipped drawing the ABC waves, which were there in the gap between the two 12345 wave patterns in my chart. And again as I mentioned, I do have some doubt about the 2-3 leg which I extended in the second chart. If tomorrow price action is positive and considerably higher, then that extension gets invalidated.
deetee is offline   (1) Thanks
Old 9th June 2022, 21:58   #66
BHPian
 
thirugata's Avatar
 
Join Date: Nov 2021
Location: Mangalore
Posts: 275
Thanked: 2,187 Times
Re: The Technical Analysis, Futures & Options Thread

I am not a EW expert, learner at best.
But what i see is a formation of a double correction.
After a Zigzag correction, if the correction had ended we should have had a 5 wave upmove, instead we had a 3 wave. That hinted that the correction is not over.
So after that, either we are forming a 5 wave down move or we had a trunkated 5th wave and we are in the process of forming a 3 wave upmove. We will know soon i guess. IMHO if the 16825 is not taken out, then we are in wave 4 . So after that we will have a wave 5 and another 3 wave upmove and another 5 wave down move to form another zigzag to complete double correction.
If we see 16825 is taken out we have to consider wave 5 was trunkated and we are in the 3 wave upmove. and another 5 wave down move will be pending whenever 3 wave upmove ends.
Correct me if I am wrong.

The Technical Analysis, Futures & Options Thread-ew.jpg

Last edited by thirugata : 9th June 2022 at 22:01.
thirugata is offline   (3) Thanks
Old 9th June 2022, 22:30   #67
BHPian
 
deetee's Avatar
 
Join Date: Oct 2007
Location: Hyderabad
Posts: 485
Thanked: 1,593 Times
Re: The Technical Analysis, Futures & Options Thread

Practical interpretation of Elliott waves is highly subjective because:
1. Each wave of the pattern can recursively have the wave patterns at smaller level
2. Some noisy movements of stock will hamper in recognising the impulsive and corrective waves.
3.The wavelength also varies at random making it tricky to number them.

Due to above complications I use EW patterns as secondary reference and will not base my trades on it.
However this is one of the most widely used metric but I just can't rely on it strongly. May be just me.

Last edited by deetee : 9th June 2022 at 22:43.
deetee is offline   (1) Thanks
Old 12th June 2022, 20:23   #68
Newbie
 
Join Date: Jun 2022
Location: Mumbai
Posts: 3
Thanked: 19 Times
Re: The Technical Analysis, Futures & Options Thread

Hi Guys -

Glad to see there are Elliott wave enthusiasts around. I must confess that there's lot of discrepancies in the wave counts posted above. To name a few, firstly wave 3 can never be the shortest and importantly, correction are usually labelled as A-B-C or in the case of double or triple three as X-Y-Z. In corrections numbers are only sub-waves within ABC.

Now that we got it out of our way, in my view the correction that NIFTY is going through since Oct'21 is a protracted side-ways correction, not necessarily deep like the one that took place in Mar'20 but excruciatingly time consuming. As Gann said, time and price are interchangeable. NIFTY rose by 100% since Mar'20 correction and that rise came rapidly within a matter of 17-18 months. When price rises that fast within a short time, the correction will be more in the form of time than price because price and time are balanced.

The best tool, in my opinion, to establish support levels are Pitchforks and as my post below will show, pitchforks has produced some amazing results with commendable accuracy.

The Technical Analysis, Futures & Options Thread-nifty-9jun.png

Daily NIFTY chart showing the corrective portion since Oct'21

See how the Mar low and Apr high stopped exactly at the support and resistance levels respectively as if it is Lakshman rekha. That's the beauty of market geometry. You don't need expensive proprietary tools to do this. Pitchfork is a powerful tool available in nearly every charting software.

From the chart it looks like NIFTY correction may have gotten over. Even assuming correction is not done yet, the bottom cannot be below the Mar'22 bottom and I highly doubt that markets will go below that level in near future.

The present challenge the markets are facing is that most key stocks like ICICI Bank, Reliance, HDFC, Titan and host of other ones are either below 50d EME or else just hovering around 50d EMA, which is a major resistance level. It would take sometime penetrating it. Till then markets won't get exciting enough.

On another note I think NIFTY will hit a major ceiling later this year and I'll explain that with Elliott wave counts in a future post. This post already gotten long, so let me take a pause here. I hope you guys found it useful. Appreciate any feedbacks. Happy to answer any questions on this or other stocks.

Cheers,

Yadunath
yadunath is offline   (7) Thanks
Old 13th June 2022, 09:51   #69
BHPian
 
deetee's Avatar
 
Join Date: Oct 2007
Location: Hyderabad
Posts: 485
Thanked: 1,593 Times
Re: The Technical Analysis, Futures & Options Thread

Quote:
Originally Posted by yadunath View Post
I must confess that there's lot of discrepancies in the wave counts posted above. To name a few, firstly wave 3 can never be the shortest
Agree with that.

Quote:
Originally Posted by yadunath View Post
the correction that NIFTY is going through since Oct'21 is a protracted side-ways correction, not necessarily deep like the one that took place in Mar'20 but excruciatingly time consuming.
This is the characteristic sign of bear markets. They are slow and steady declining not steep.

Quote:
Originally Posted by yadunath View Post
From the chart it looks like NIFTY correction may have gotten over. Even assuming correction is not done yet, the bottom cannot be below the Mar'22 bottom and I highly doubt that markets will go below that level in near future.
They will certainly go below that bottom, there is no stopping at present levels. There will be some support around 14500 level where we may see some bounce, but when that reverses, market will go below 14k levels. All this will take time .

Last edited by deetee : 13th June 2022 at 10:00. Reason: typos
deetee is offline   (5) Thanks
Old 13th June 2022, 09:59   #70
Newbie
 
Join Date: Jun 2022
Location: Mumbai
Posts: 3
Thanked: 19 Times
Re: The Technical Analysis, Futures & Options Thread

The markets have dropped with a significant gap today and it looks probable that the markets will challenge the Mar'22 low. The markets will find significant support at 15400 levels and very likely bottom out at that level. It's probable the markets may bounce back from that level around summer solstice (Jun 21st, give or take a day).

Last edited by yadunath : 13th June 2022 at 10:26.
yadunath is offline  
Old 13th June 2022, 13:01   #71
BHPian
 
thirugata's Avatar
 
Join Date: Nov 2021
Location: Mangalore
Posts: 275
Thanked: 2,187 Times
Re: The Technical Analysis, Futures & Options Thread

Found this very creative way of plotting the chart . Sharing just for fun...

The Technical Analysis, Futures & Options Thread-fvhs75muuaaabrb.jpeg

Iske neeche bhagwan malik... seems to be apt title for this...
thirugata is offline   (4) Thanks
Old 13th June 2022, 14:09   #72
Newbie
 
Join Date: Jun 2022
Location: Mumbai
Posts: 3
Thanked: 19 Times
Re: The Technical Analysis, Futures & Options Thread

There are two parts of my own mind presenting counter arguments. One is what I already posted based on daily chart and pitchfork, which seems to suggest a major halt at 15400 levels. If that support level doesn't hold, then the skeptical side of my mind says that NIFTY may go as far below as 14500-14700 levels. This is based especially on the weekly chart.

Look at the chart below. This is a weekly chart of NIFTY, wherein each bar represents one week. The chart covers the period from Mar'20 low. NIFTY completed a roaring wave (3) that took the index to all-time highs and then hit a peak in Oct'21. Since then, the markets have been on a drag. This could be viewed as a double three or alternately as a triangle. Sometimes, you get more clarity in hindsight, but presently it can be viewed as a triangle, tracing out the last leg (e), which when completed will also complete wave (4) correction at intermediate level.

Now triangle has several implications. At one level, when the triangle completes in ensuing days/ weeks, the wave (5) will start briskly making people forget all the bear market woes creating a rush to buy. Ironically, wave (5) also marks the completion of five waves since Mar'20, which will then result in a major drag down. That's some months away from now, we well revisit that when we get closer there. Right now, we are interested to see completion of wave (4) triangle.
Attached Thumbnails
The Technical Analysis, Futures & Options Thread-nifty-weekly.png  

yadunath is offline  
Old 13th June 2022, 14:31   #73
BHPian
 
K_Drive's Avatar
 
Join Date: Jun 2019
Location: BLR - PKD
Posts: 160
Thanked: 813 Times
Re: The Technical Analysis, Futures & Options Thread

If someone is following Manappuram Finance, looks like it is near multi year trend line support.
The Technical Analysis, Futures & Options Thread-img20220613wa0019.jpg
K_Drive is offline  
Old 13th June 2022, 15:36   #74
BHPian
 
deetee's Avatar
 
Join Date: Oct 2007
Location: Hyderabad
Posts: 485
Thanked: 1,593 Times
Re: The Technical Analysis, Futures & Options Thread

Based on some rough analysis, I have a feeling that we are going to see a short term bounce to 16100 level this week itself or early next week. Probably Fed may not do a hard landing , atleast for this meeting, as everyone is fearing. That can give some boost to battered sentiments.
deetee is offline  
Old 13th June 2022, 17:49   #75
BHPian
 
thirugata's Avatar
 
Join Date: Nov 2021
Location: Mangalore
Posts: 275
Thanked: 2,187 Times
Re: The Technical Analysis, Futures & Options Thread

As Nifty and Bank nifty are holding on to a critical support, Gold seems to have broken out.

The Technical Analysis, Futures & Options Thread-gold.jpg

The Technical Analysis, Futures & Options Thread-banknifty.jpg
thirugata is offline   (1) Thanks
Reply

Most Viewed


Copyright ©2000 - 2024, Team-BHP.com
Proudly powered by E2E Networks