| |||||||

| Search Forums |
| Advanced Search |
| Go to Page... |
 |
| Search this Thread |  57,337 views |
 17th October 2017, 10:15
| #16 |
| BHPian Join Date: Nov 2007 Location: Bangalore
Posts: 966
Thanked: 1,580 Times
| Re: Revenue calculation of cars sold in India - How many $$$ each model brings to its maker Thank you for doing this on a consistent basis. I love reading these statistics that show how much these guys are raking in. While we can talk a lot about sales positions etc. in the end, it's the money that matters for these manufacturers. Also, this could be an indication of how much they are willing to invest in future models or variants. |

|  (1)
Thanks (1)
Thanks
|
| The following BHPian Thanks Mad Max for this useful post: | jpcoolguy |
| |
|
17th October 2017, 10:19
| #17 |
| BHPian Join Date: Aug 2017 Location: Bengaluru
Posts: 832
Thanked: 4,143 Times
| Re: Revenue calculation of cars sold in India - How many $$$ each model brings to its maker This is a tremendous effort JpCoolGuy, Amazing! Humongous data that you have collected, analyzed and presented it lucidly. Since this effort has now completed one year, may be some charts on revenue trends of manufacturers over the year would be interesting to study. Examples: Volume chart of different makers over the year, Revenue chart, Volume vs Revenue chart - the way different manufacturers have adjusted their strategies over the year and the effect on their revenues. Since you have so much of data, may be we can derive meaningful information from them. |
|
| (1)
Thanks
|
| The following BHPian Thanks Thermodynamics for this useful post: | jpcoolguy |
|
4th November 2017, 14:54
| #18 | |
| BHPian Join Date: Jan 2016 Location: Chennai
Posts: 615
Thanked: 1,542 Times
| Re: Revenue calculation of cars sold in India - How many $$$ each model brings to its maker Quote:
Only thing I can do is to extrapolate the prices of Dec '16 to first 3 months of 2017 and extrapolate the prices of Jun '17 to the next 3 months of 2017, which would lead to more approximation. I can continue this exercise for another 2 months and may be we can have the charts for 6 months atleast in Jan '18. | |
|
| (1)
Thanks
|

| The following BHPian Thanks jpcoolguy for this useful post: | Thermodynamics |
|
10th November 2017, 22:46
| #19 |
| BHPian Join Date: Jan 2016 Location: Chennai
Posts: 615
Thanked: 1,542 Times
| Re: Revenue calculation of cars sold in India - How many $$$ each model brings to its maker Revenue Calculation data for last month sales - Oct '17. Top 25 Cars based on Revenue (calculated based on 75th Percentile of the Avg. Ex-Showroom Price):  1. Dzire has cooled down to 20K levels, from the humongous 33K levels for past 2 months, but still kept the top position - the revenue was "just" 1339 crores. 2. Baleno has retained the second position, but Creta and Innova surpassed Brezza and pushed it to 5th position. But, mind you, all these are very closely placed and these numbers are just approximations, so it could be either Brezza, Creta or Innova in 3rd/4th/5th - take your pick. 3. Hyundai has Grand i10 and i20 at 6th and 7th positions respectively and Maruti Suzuki has filled the last 3 positions in the Top-10. 4. Maruti Suzuki has 6 cars in Top 10, Hyundai has 3 and Toyota has Innova. Maruti Suzuki also has Celerio just outside of Top-10. 5. In Top 25 positions, Maruti Suzuki has 10 cars, followed by Hyundai with 5 cars, M&M with 3 cars, Toyota and Honda with 2 each and Tata, Jeep and Renault sharing the remaining 3 positions with 1 each. 7. Bolero is the highest ranking car (at 13) for M&M, City (at 16) for Honda, Compass (at 17) for Jeep, Tiago (at 22) for Tata, Kwid (at 23) for Renault, Polo (at 33) for VW, Endeavor (at 41) for Ford, Rapid (at 43) for Skoda, Redi-Go (at 46) for Datsun, Micra (at 55) for Nissan and Punto (at 73) for Fiat. 7. Xcent (24 / 27), Eeco (17 / 29), KUV 100 (23 / 30) and Omni (14 / 34) from the Top-25 based on sales volume have moved out of the Top-25 chart based on sales revenue. They are replaced by Fortuner (35 / 12), Compass (33 / 17), Scorpio (26 / 18) and XUV500 (30 / 19) - note that the first value within brackets denotes the Volume rank and the second value denotes the corresponding Revenue rank. 8. Compared to the last month's (Sep '17) Top-25 revenue ranking, Ecosport (59 / 18), Ignis (31 / 24) and Eeco (29 / 25) have moved out and they are replaced by S-Cross (14 / 57), Celerio (11 / 29) and Eon (25 / 31) - note that the first value within brackets denotes Oct '17 Revenue rank and the second value denotes the Sep '17 Revenue rank. Top 25 Cars based on Sales Volume (and their corresponding Revenue rank):  OEM's Volume Market Share Vs Revenue Market Share:  1. As always, Maruti Suzuki's revenue market share is approx. 8% lesser than their volume market share. As someone suggested, I have also taken the Ratio which is really a good metric to understand the Revenue Vs Volume figures. Maruti is gaining 0.84 revenue per car sold, whereas Toyota is exactly doubling the rate (ratio at 2.0). 2. Renault, Tata & Datsun are the manufacturers other than Maruti to see a fall in terms of Revenue Market Share compared to the Volume Market Share - as expected, due to their larger volume in small cars. 3. Renault-Nissan-Datsun alliance has bigger market share in terms of Volume (5.21%), but when it comes to Revenue they have only 3.36% (lesser by 1.85%, when compared to volume market share). P.S.: Please note the revenues for the 3 Germans, JLR, Volvo, Porsche and other Luxury car makers are not included, who may have more revenue market share when compared to their minimal volume market share. For example, Mercedes Benz's revenue might be close to VW's revenue or may be more than that and this might have some impact in the actual revenue calculations. But, we do not have the individual numbers of the Luxury cars to do the calculation. Full Chart for your perusal:  Last edited by jpcoolguy : 10th November 2017 at 22:48. |
|
| (4)
Thanks
|
| The following 4 BHPians Thank jpcoolguy for this useful post: | BoneCollector, dean5545, Sahil, Thermodynamics |
|
10th November 2017, 23:26
| #20 |
| BHPian Join Date: Aug 2017 Location: Bengaluru
Posts: 832
Thanked: 4,143 Times
| Re: Revenue calculation of cars sold in India - How many $$$ each model brings to its maker Thanks again for sharing JP. The story of Compass is intriguing. The revenue to volume share ratio is astounding 2.14. If I assume Toyota's major bread winners are Innova and Fortuner, that sums up to 1275 Cr. The Compass alone is 324 Cr. That would be 25% of Toyota's revenue. Achieving these figures in just 3 months by someone with barely any service and sales network is astonishing. |
|
| (1)
Thanks
|
| The following BHPian Thanks Thermodynamics for this useful post: | jpcoolguy |
|
27th December 2017, 13:03
| #21 |
| BHPian Join Date: Jan 2016 Location: Chennai
Posts: 615
Thanked: 1,542 Times
| Re: Revenue calculation of cars sold in India - How many $$$ each model brings to its maker Revenue Calculation data for last month sales - Nov '17. Top 25 Cars based on Revenue (calculated based on 75th Percentile of the Avg. Ex-Showroom Price):  1. This month, we have 3 cars surpassing the 1000 Cr thresold - Dzire, Baleno and Brezza (all in that order), all belonging to Maruti Suzuki. It's very surprising that when other manufacturers have posted negative growth this month, MSIL keeps churning out money making machines. No wonder the shares of MSIL is at an all time high. 2. Innova and Creta complete the Top 5, with Creta losing some steam this month. 3. Again MSIL has Alto and Swift in 6th and 7th positions respectively, followed by the regular entries from Hyundai - Grand i10 and i20, with WagonR rounding off the Top 10 list. 4. Maruti Suzuki has 6 cars in Top 10, Hyundai has 3 and Toyota has Innova (Toyota also has Fortuner at 11th position, just outside of Top 10). 5. In Top 25 positions, Maruti Suzuki has 11 cars (only these 3 cars - Ignis, Omni and Gypsy out of 14 cars in their portfolio are outside of Top 25), followed by Hyundai with 4 cars, M&M, Toyota, Honda and Tata with 2 each and Jeep and Ford sharing the remaining 2 positions with 1 each. 6. No cars from Renault, this time, inside Top 25 (Kwid is at 27). Compass has moved upto 13th position and Nexon is a new entrant in Top 25 - well done both.  7. Ecosport is the highest ranking car (at 12) for Ford, Compass (at 13) for Jeep, Scorpio (at 14) for M&M, City (at 18) for Honda, Tiago (at 19) for Tata, Kwid (at 27) for Renault, Polo (at 38) for VW, Rapid (at 44) for Skoda, Redi-Go (at 49) for Datsun, Micra (at 55) for Nissan and Punto (at 75) for Fiat. 8. Ignis (25 / 26), Kwid (15 / 27), Eon (17 / 28) and Omni (13 / 31) from the Top-25 based on sales volume have moved out of the Top-25 chart based on sales revenue. They are replaced by Fortuner (31 / 11), Compass (29 / 13), City (27 / 18) and S-Cross (26 / 24) - note that the first value within brackets denotes the Volume rank and the second value denotes the corresponding Revenue rank. 9. Compared to the last month's (Oct '17) Top-25 revenue ranking, XUV 500 (32 / 19), Kwid (27 / 23) and Eon (28 / 25) have moved out and they are replaced by Ecosport (12 / 59), Nexon (21 / 26) and Eeco (25 / 29) - note that the first value within brackets denotes Nov '17 Revenue rank and the second value denotes the Oct '17 Revenue rank. Top 25 Cars based on Sales Volume (and their corresponding Revenue rank):  OEM's Volume Market Share Vs Revenue Market Share:  1. Due to their dependency on smaller cars, Maruti Suzuki's revenue market share is approx. 8% lesser than their volume market share. In terms of Ratio of revenue per number of cars sold - Maruti has a ratio of 0.84, whereas Toyota, Jeep and Skoda (with their minuscule portfolio but having larger cars) are more than doubling their revenue per number of cars sold. 2. To understand better, Maruti has to sell 119 cars (per every 100 cars sold in the market) to break even in Revenue terms (which anyway they sell happily more than any other manufacturers, churning out blockbuster products), whereas Toyota/Jeep/Skoda have to sell only 49 cars (per every 100 cars sold in the market) to break even (and they have been contend to do so, by not introducing the mass market cars). Datsun has sell approx. 204 cars (per every 100 cars), since their ratio is only 0.49. Renault is the other manufacturer who has least ratio than Maruti, with 0.77, needing to sell at least 129 cars (per every 100 cars). 3. Renault, Tata & Datsun are the manufacturers other than Maruti to see a fall in terms of Revenue Market Share compared to the Volume Market Share - as expected, due to their larger volume in small cars. P.S.: Please note the revenues for the 3 Germans, JLR, Volvo, Porsche and other Luxury car makers are not included, who may have more revenue market share when compared to their minimal volume market share. For example, Mercedes Benz's revenue might be close to VW's revenue or may be more than that and this might have some impact in the actual revenue calculations. But, we do not have the individual numbers of the Luxury cars to do the calculation. Full Chart for your perusal:  |
|
| (9)
Thanks
|
| The following 9 BHPians Thank jpcoolguy for this useful post: | aman9393, CarguyNish, Klub Class, luvDriving, neerajdan, RaghuVis, S.MJet, Sahil, Thermodynamics |
|
8th January 2018, 12:54
| #22 |
| BHPian Join Date: Jan 2016 Location: Chennai
Posts: 615
Thanked: 1,542 Times
| Re: Revenue calculation of cars sold in India - How many $$$ each model brings to its maker Recently, saw a recent article in Autopunditz w.r.t the sales split up based on fuel type (Petrol / Diesel). http://www.autopunditz.com/autopedia...nger-vehicles/ So, I thought of using this split up to incorporate few changes in the revenue calculation model, to increase the accuracy of the calculations - but remember still these are approximations. Now, I need to tweak the logic, in order to capture the ex-showroom price of Petrol and Diesel variants separately and then calculating the 75th Percentile of the price and also to change the GST + Cess % accordingly - 29% for Petrol cars in < 4m segment and 31% for Diesel cars in < 4m segment. And that is humongous amount of data to be processed and let me try to incorporate these changes in the latest monthly sales - Dec '17, which is yet to be published. The existing logic will still hold true for all the vehicles powered by a single fuel type - either Petrol or Diesel. For all the other vehicles, which has both Petrol and Diesel variants, the new logic will have more accuracy since the 75th Percentile price will be calculated separately for Petrol and Diesel variants. In the earlier logic, the 75th percentile price will always be in the Diesel variants territory. The cars which are Petrol biased (like Baleno, Grand i10, Tiago, Ignis, Jazz, City, Tigor, Micra, etc) will be negatively impacted by this new calculation - their revenue may be scaled down. On the other hand, the cars which are Diesel biased (like Ecosport, Compass, Nexon, Etios, Duster, Rapid, Zest, Tucson, Bolt, Terrano, etc) will be positively impacted - their revenue may be scaled up. There are also some cars which are almost neutral (like Ameo, Dzire, Verna, Ciaz, WR-V, Liva, Aspire, BR-V, etc) which will be marginally impacted, due to new calculations. I will try to explain the logic changes with few examples shown below, based on Nov '17 data - I had taken the examples from both the extremes as stated above. Example # 1: Maruti Suzuki Ignis Petrol - 93% and Diesel - 7% Old Calculation Logic: 75th Percentile - 725,000 GST + Cess - 30% Final Price - 557,692 So, the revenue from the 3,412 units sold in Nov '17 was 190.28 Cr (557,692 x 3,412). New Calculation Logic:  Now, the revenue calculation formula is - 3,412 x 0.93 x 503,876 + 3,412 x 0.07 x 580,153 = 173.74 Cr. Example # 2: Tata Nexon Petrol - 29% and Diesel - 71% Old Calculation Logic: 75th Percentile - 875,000 GST + Cess - 30% Final Price - 673,077 So, the revenue from the 4,163 units sold in Nov '17 was 280.2 Cr (673,077 x 4,163). New Calculation Logic:  Now, the revenue calculation formula is - 4,163 x 0.29 x 624,031 + 4,163 x 0.71 x 706,107 = 284.04 Cr. As mentioned earlier, you can see how the revenues are impacted for both type of vehicles. I will incorporate these calculations as part of Dec '17 revenue calculations and post them here. |
|
| (6)
Thanks
|
| The following 6 BHPians Thank jpcoolguy for this useful post: | aman9393, AYP, dean5545, giri1.8, Thermodynamics, vamsi.kona |
|
10th January 2018, 14:23
| #23 |
| BHPian Join Date: Jan 2016 Location: Chennai
Posts: 615
Thanked: 1,542 Times
| Re: Revenue calculation of cars sold in India - How many $$$ each model brings to its maker Revenue Calculation data for last month sales - Dec '17. Note: Please refer to my previous post, on the new calculations based on the Fuel split-up, in order to increase the accuracy of the numbers (but mind you, these are still just approximate numbers, mostly the projections based on few assumptions and few facts). Top 25 Cars based on Revenue (calculated based on 75th Percentile of the Avg. Ex-Showroom Price): 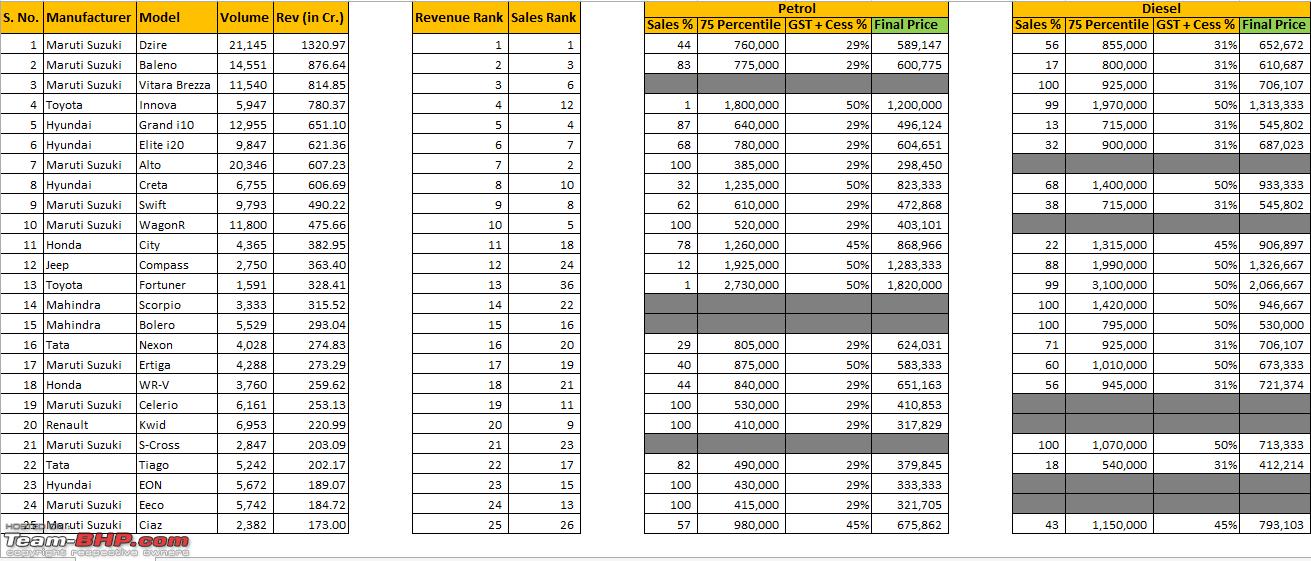 1. As the year end sales are sluggish as expected, we have only Dzire crossing the 1000 Cr thresold. 2. The usual suspects, Baleno, Brezza and Innova follows Dzire with a surprise entry of Grand i10 in 5th position. Creta, with a below average month, moved down the pecking order to 8th position. 3. i20, Alto and Swift, WagonR sandwiches Creta completing the Top-10. 4. Maruti Suzuki has 6 cars in Top 10, Hyundai has 3 and Toyota has Innova. City has improved to 11th position and Compass has moved up one position to 12th, with Fortuner moving down 2 positions to 13th. 5. In Top 25 positions, Maruti Suzuki has 11 cars (only these 3 cars - Ignis, Omni and Gypsy out of 14 cars in their portfolio are outside of Top 25), followed by Hyundai with 4 cars, M&M, Toyota, Honda and Tata with 2 each and Jeep and Renault sharing the remaining 2 positions with 1 each. 6. City is the highest ranking car (at 11) for Honda, Compass (at 12) for Jeep, Scorpio (at 14) for M&M, Nexon (at 16) for Tata, Kwid (at 20) for Renault, Aspire (at 30) for Ford, Polo (at 37) for VW, Rapid (at 38) for Skoda, Redi-Go (at 48) for Datsun, Micra (at 61) for Nissan and Punto (at 76) for Fiat. 7. Xcent (25 / 28) and Omni (14 / 33) from the Top-25 based on sales volume have moved out of the Top-25 chart based on sales revenue. They are replaced by Fortuner (36 / 13) and Ciaz (26 / 25) - note that the first value within brackets denotes the Volume rank and the second value denotes the corresponding Revenue rank. 8. Compared to the last month's (Nov '17) Top-25 revenue ranking, Ecosport (32 / 12) and Verna (26 / 16) have moved out and they are replaced by Kwid (20 / 27) and Eon (23 / 28) - note that the first value within brackets denotes Dec '17 Revenue rank and the second value denotes the Nov '17 Revenue rank. Top 25 Cars based on Sales Volume (and their corresponding Revenue rank):  OEM's Volume Market Share Vs Revenue Market Share: 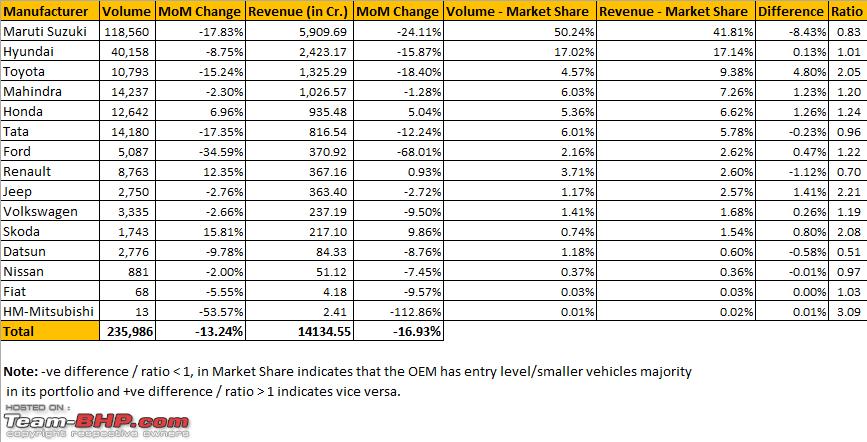 1. Due to their dependency on smaller cars, Maruti Suzuki's revenue market share is approx. 8% lesser than their volume market share. In terms of Ratio of revenue per number of cars sold - Maruti has a ratio of 0.83, whereas Toyota, Jeep and Skoda (with their minuscule portfolio but having larger cars) are more than doubling their revenue per number of cars sold. 2. To understand better, Maruti has to sell 120 cars (per every 100 cars sold in the market) to break even in Revenue terms (which anyway they sell happily more than any other manufacturers, churning out blockbuster products). Below is the list with number of cars, every manufacturer have to sell, per 100 cars sold in the market. Number of Cars, to be sold, per 100 cars, in order to break even in revenue terms: Maruti Suzuki - 120 Hyundai - 99 Toyota - 49 M&M - 83 Honda - 81 Tata - 104 Ford - 82 Renault - 143 Jeep - 45 VW - 84 Skoda - 48 Datsun - 196 Nissan - 103 Fiat - 97 Mitsubishi - 32 3. The Sales Volume have been down by 13.24% this month, when compared to last month, whereas the Sales Revenue have been down by 16.93%. P.S.: Please note the revenues for the 3 Germans, JLR, Volvo, Porsche and other Luxury car makers are not included, who may have more revenue market share when compared to their minimal volume market share. For example, Mercedes Benz's revenue might be close to VW's revenue or may be more than that and this might have some impact in the actual revenue calculations. But, we do not have the individual numbers of the Luxury cars to do the calculation. Full Chart for your perusal: 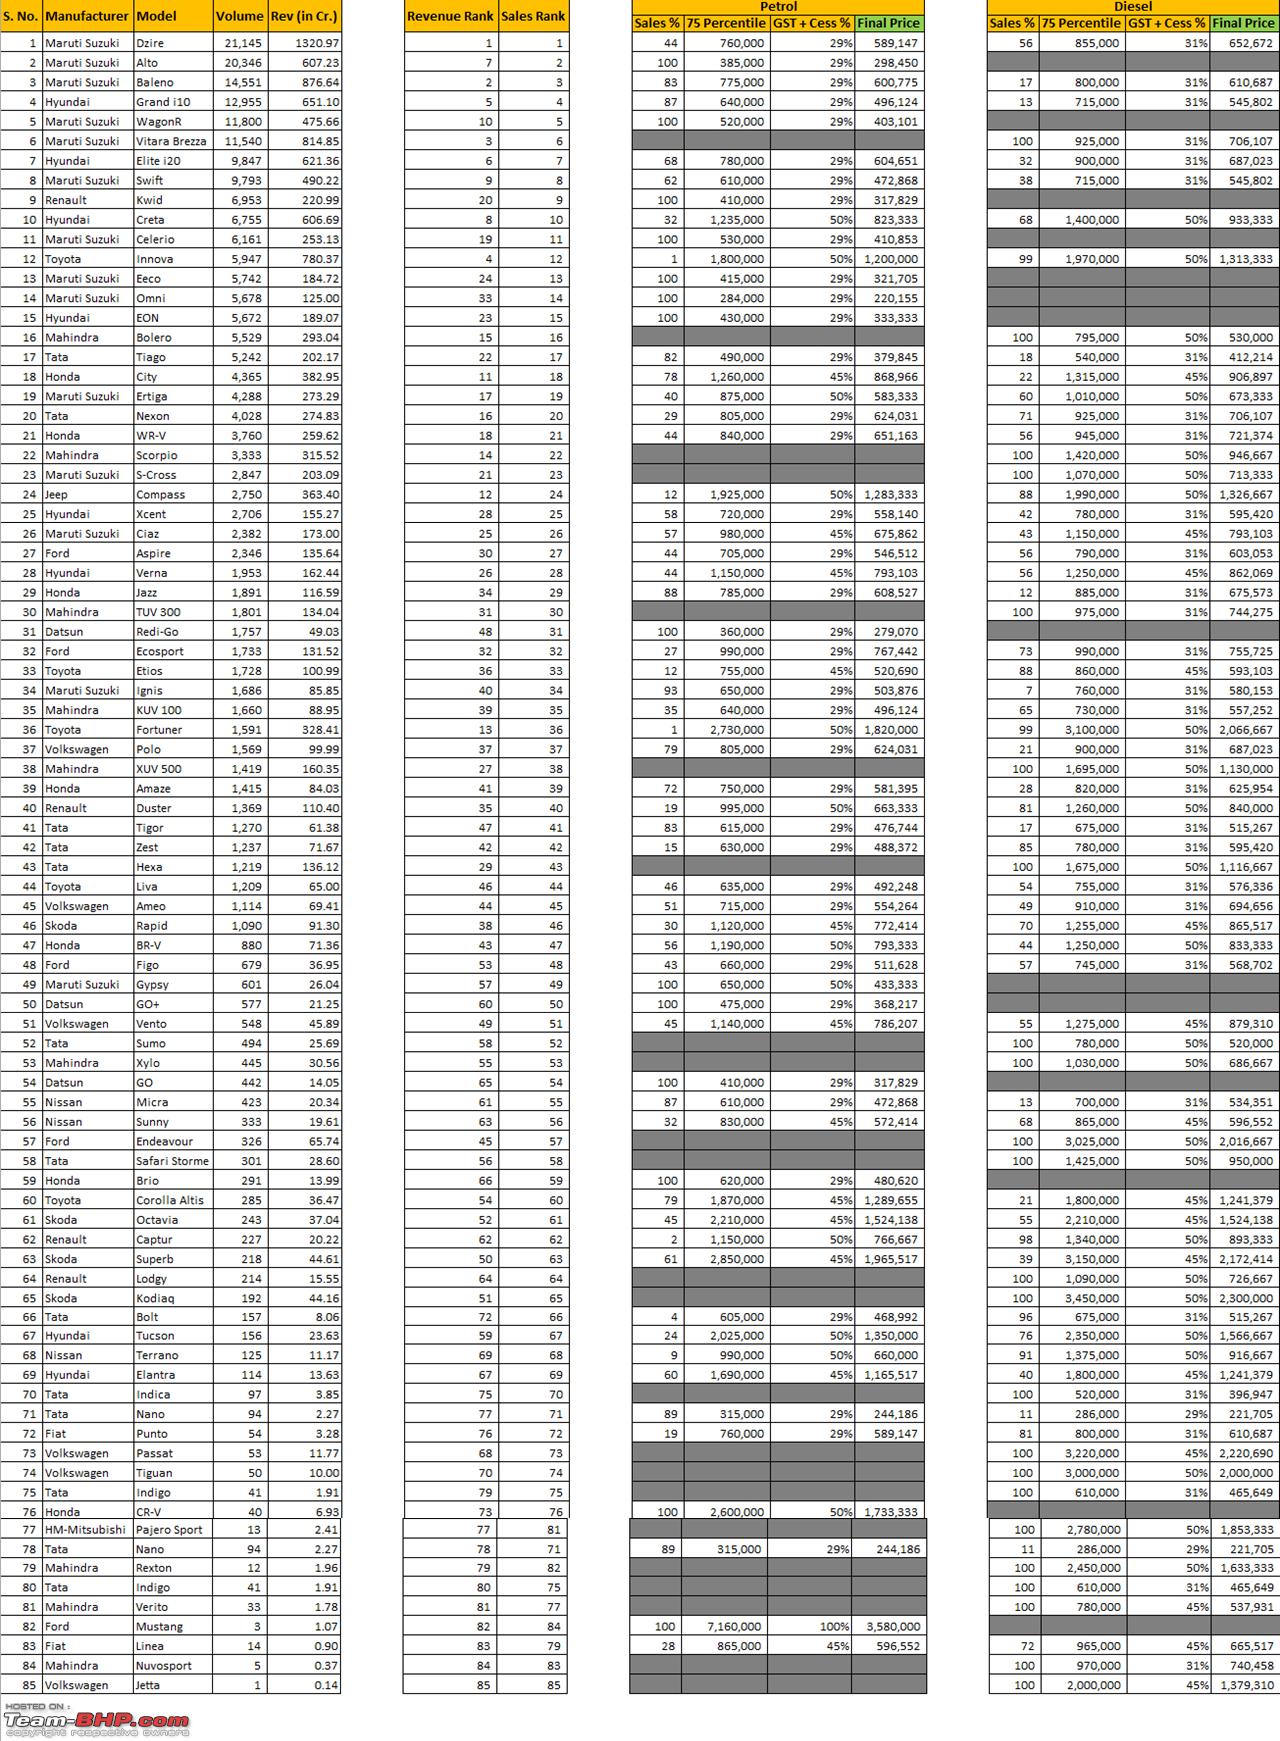 |
|
| (6)
Thanks
|
| The following 6 BHPians Thank jpcoolguy for this useful post: | aman9393, blackwasp, dean5545, giri1.8, RaghuVis, Thermodynamics |
|
9th February 2018, 21:22
| #24 |
| BHPian Join Date: Jan 2016 Location: Chennai
Posts: 615
Thanked: 1,542 Times
| Re: Revenue calculation of cars sold in India - How many $$$ each model brings to its maker Revenue Calculation data for last month sales - Jan '18. Top 25 Cars based on Revenue (calculated based on 75th Percentile of the Avg. Ex-Showroom Price): 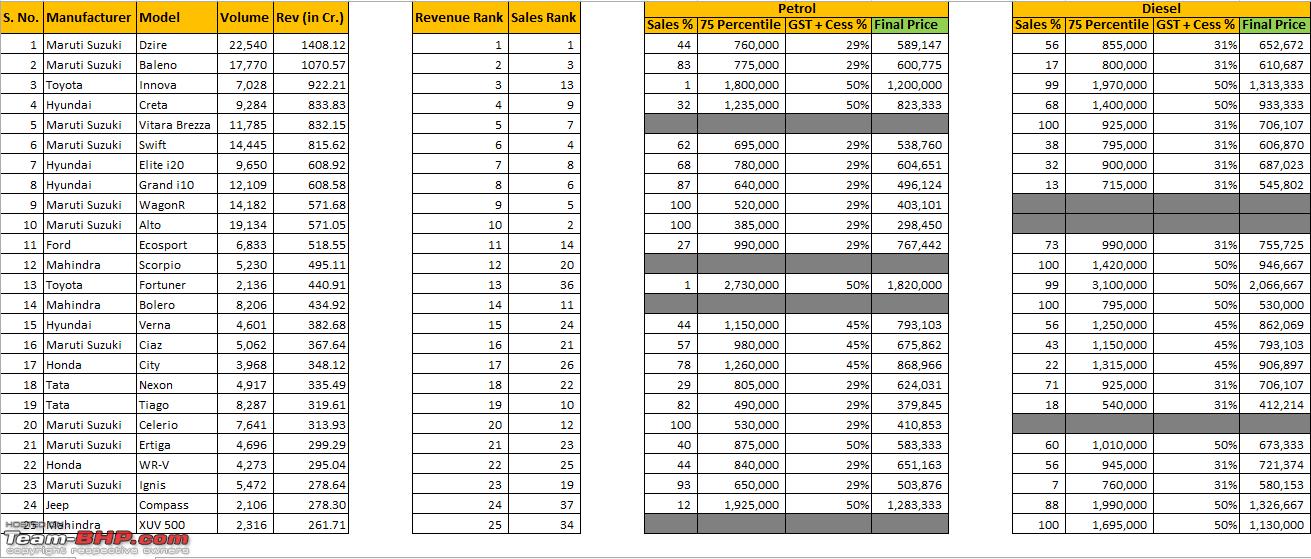 1. After the lacklustre December, January seems to have been very good for most of the manufacturers. We have 2 cars this time in 1000 Cr. club - Dzire and Baleno. 2. Vitara Brezza have been pushed down to 5th position, due to pretty good sales for Innova and Creta both of which have leapfrogged Brezza and occupies the 3rd and 4th slots. 3. Swift, i20, i10, WagonR and Alto forms the bottom five of the Top-10 positions respectively. 4. Maruti Suzuki has 6 cars in Top 10, Hyundai has 3 and Toyota has Innova. Ecosport with its best ever sales is just outside of Top-10 in the 11th position and City was pushed down to 17th from the 11th slot last month. 5. In Top 25 positions, Maruti Suzuki has 10 cars, followed by Hyundai with 4 cars, M&M with 3 cars, Toyota, Honda and Tata with 2 each and Ford and Jeep sharing the remaining 2 positions with 1 each. No Renault this time in Top-25, instead Ford has entered inside. 6. Ecosport is the highest ranking car (at 11) for Ford, Scorpio (at 12) for M&M, City (at 17) for Honda, Nexon (at 18) for Tata, Compass (at 24) for Jeep, Kwid (at 31) for Renault, Polo (at 39) for VW, Redi-Go (at 46) for Datsun, Rapid (at 47) for Skoda, Micra (at 59) for Nissan, Pajero Sport (at 73) for HM-Mitsubishi and Punto (at 78) for Fiat. 7. Eon (16 / 27), Eeco (17 / 28), Kwid (18 / 31) and Omni (15 / 36) from the Top-25 based on sales volume have moved out of the Top-25 chart based on sales revenue. They are replaced by Fortuner (36 / 13), City (26 / 17), Compass (37 / 24) and XUV 500 (34 / 25) - note that the first value within brackets denotes the Volume rank and the second value denotes the corresponding Revenue rank. 8. Compared to the last month's (Dec '17) Top-25 revenue ranking, Kwid (31 / 20), S-Cross (26 / 21), Eon (27 / 23) and Eeco (28 / 24) have moved out and they are replaced by Ecosport (11 / 32), Verna (15 / 28), Ciaz (16 / 26) and XUV 500 (25 / 38) - note that the first value within brackets denotes Jan '18 Revenue rank and the second value denotes the Dec '17 Revenue rank. Top 25 Cars based on Sales Volume (and their corresponding Revenue rank):  OEM's Volume Market Share Vs Revenue Market Share:  1. Due to their dependency on smaller cars, Maruti Suzuki's revenue market share is approx. 8% lesser than their volume market share. In terms of Ratio of revenue per number of cars sold - Maruti has a ratio of 0.84, whereas Toyota is having a ratio of 2.09 more than doubling their revenue per number of cars sold. 2. To understand better, Maruti has to sell 119 cars (per every 100 cars sold in the market) to break even in Revenue terms. Below is the list with number of cars, every manufacturer have to sell, per 100 cars sold in the market. Number of Cars, to be sold, per 100 cars, in order to break even in revenue terms: Maruti Suzuki - 119 Hyundai - 96 M&M - 84 Toyota - 48 Honda - 85 Tata - 115 Ford - 78 Renault - 147 Jeep - 46 VW - 86 Skoda - 49 Datsun - 204 Nissan - 106 Fiat - 99 Mitsubishi - 33 3. The Sales Volume has increased by 19.17% this month when compared to last month, and the Sales Revenue has increased by 21.56%. P.S.: Please note the revenues for the 3 Germans, JLR, Volvo, Porsche and other Luxury car makers are not included, who may have more revenue market share when compared to their minimal volume market share. For example, Mercedes Benz's revenue might be close to VW's revenue or may be more than that and this might have some impact in the actual revenue calculations. But, we do not have the individual numbers of the Luxury cars to do the calculation. Full Chart for your perusal: 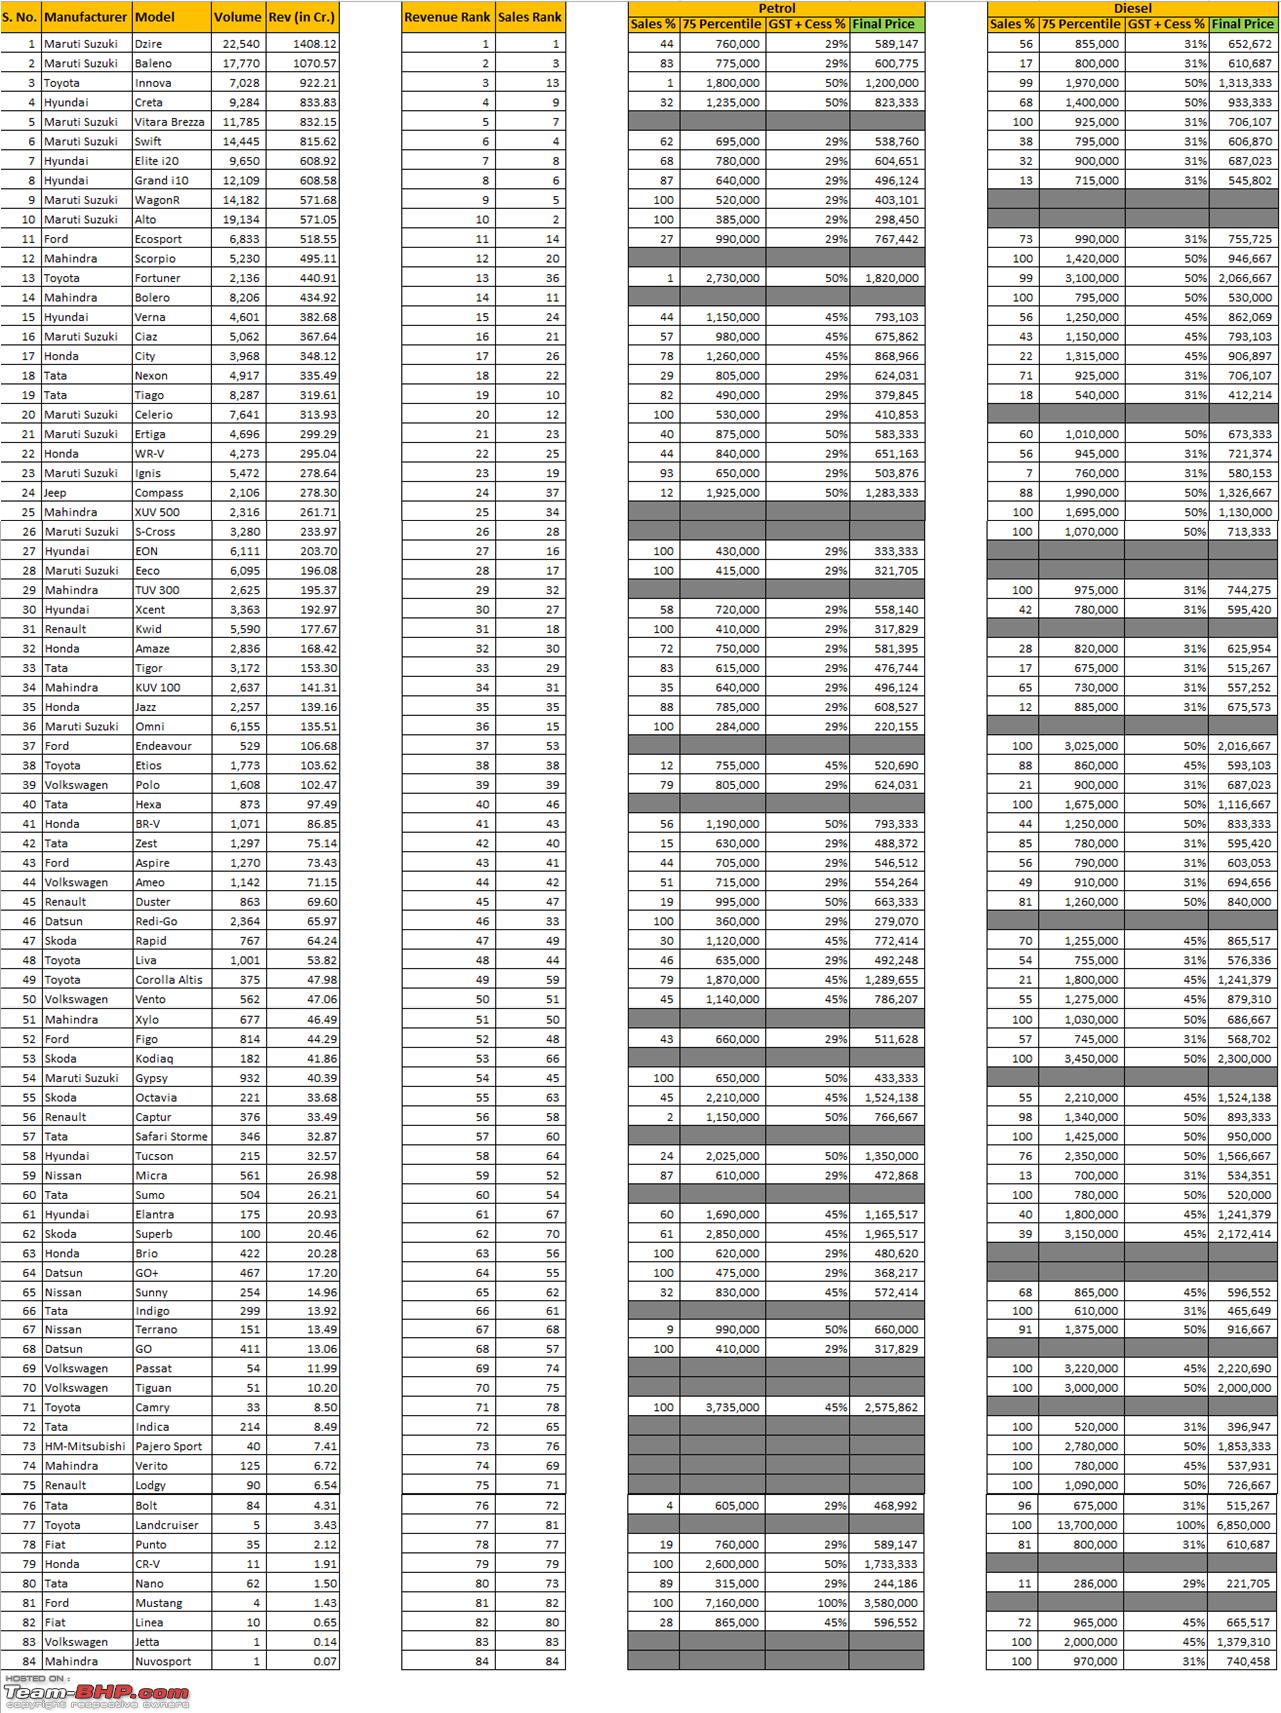 |
|
| (4)
Thanks
|
| The following 4 BHPians Thank jpcoolguy for this useful post: | aman9393, blackwasp, espraveen, giri1.8 |
|
9th March 2018, 16:24
| #25 |
| BHPian Join Date: Jan 2016 Location: Chennai
Posts: 615
Thanked: 1,542 Times
| Re: Revenue calculation of cars sold in India - How many $$$ each model brings to its maker Revenue Calculation data for last month sales - Feb '18. Top 25 Cars based on Revenue (calculated based on 75th Percentile of the Avg. Ex-Showroom Price): 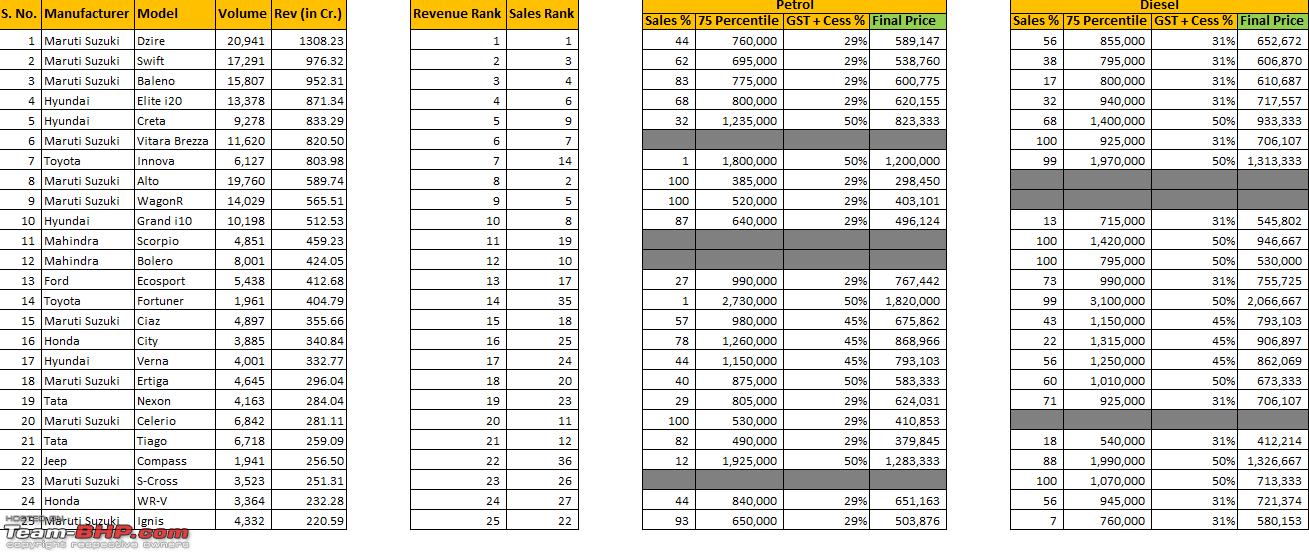 1. We have only one car, this time in the 1000 Cr. club and it is as always the Dzire. 2. The two new cars, new gen Swift and facelifted i20 have entered the Top 5, slotting in 2nd and 4th position, after a good first month of sales. And the impact is that Brezza and Innova has been pushed out of Top 5, to 6th and 7th position respectively. I think this is the 1st time Innova has been out of Top 5, excluding the GST month, Jun '17. 3. Baleno is in 3rd position and Alto, WagonR and Grand i10 completes the remaining Top 10 positions. 4. Maruti Suzuki has 6 cars in Top 10, Hyundai has 3 and Toyota has Innova. M&M has 2 cars just outside of Top 10 - Scorpio and Bolero capturing 11th and 12h positions respectively. 5. In Top 25 positions, Maruti Suzuki has 11 cars, followed by Hyundai with 4 cars, M&M with 2 cars, Toyota, Honda and Tata with 2 each and Ford and Jeep sharing the remaining 2 positions with 1 each. Again, no Renault this time in Top-25 and Ford has retained its one position. 6. Scorpio is the highest ranking car (at 11) for M&M, Ecosport (at 13) for Ford, City (at 16) for Honda, Nexon (at 19) for Tata, Compass (at 22) for Jeep, Kwid (at 28) for Renault, Polo (at 40) for VW, Redi-Go (at 42) for Datsun, Rapid (at 47) for Skoda, Micra (at 60) for Nissan and Punto (at 77) for Fiat. 7. Eeco (15 / 27), Kwid (16 / 28), Eon (21 / 32) and Omni (13 / 33) from the Top-25 based on sales volume have moved out of the Top-25 chart based on sales revenue. They are replaced by Fortuner (35 / 14), Compass (36 / 22), S-Cross (26 / 23) and WR-V (27 / 24) - note that the first value within brackets denotes the Volume rank and the second value denotes the corresponding Revenue rank. 8. Compared to the last month's (Jan '18) Top-25 revenue ranking, only XUV 500 (26 / 25) has been moved out and it is replaced by S-Cross (23 / 26) - note that the first value within brackets denotes Feb '18 Revenue rank and the second value denotes the Jan '18 Revenue rank. Top 25 Cars based on Sales Volume (and their corresponding Revenue rank): 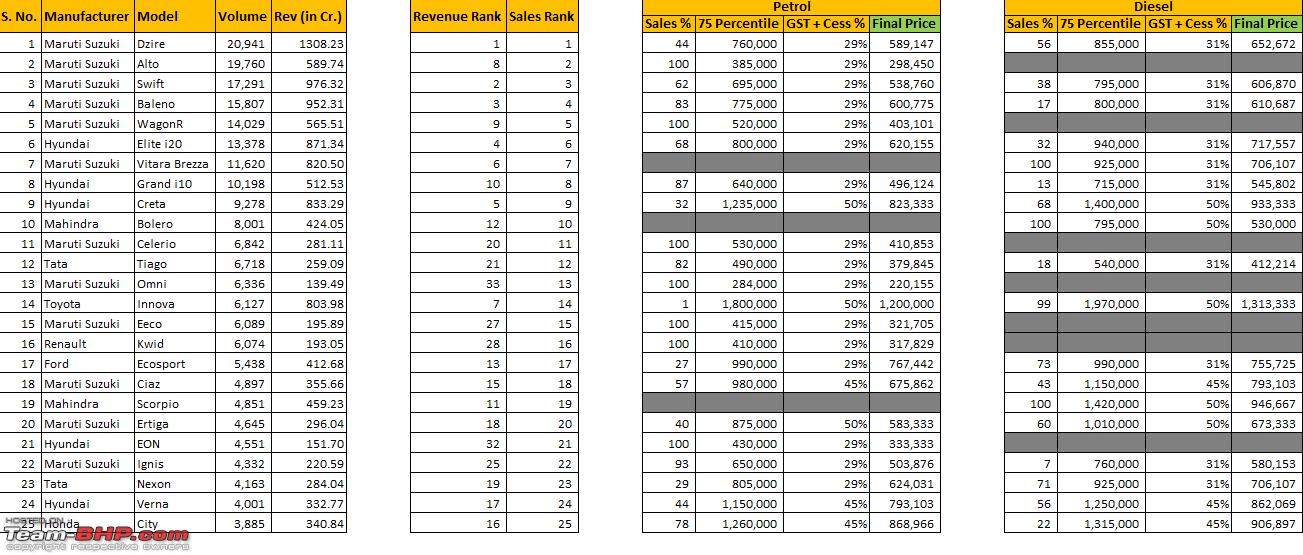 OEM's Volume Market Share Vs Revenue Market Share:  1. Almost all the manufacturers has a negative growth in Volume terms, except for Renault/Skoda/Nissan. However, in Revenue terms Hyundai has managed to post marginal positive growth despite the negative volume growth, all thanks to the new facelifted i20 with its fat margin. 2. Due to their dependency on smaller cars, Maruti Suzuki's revenue market share is approx. 8% lesser than their volume market share. In terms of Ratio of revenue per number of cars sold - Maruti has a ratio of 0.84, whereas Toyota is having a ratio of 2.01 more than doubling their revenue per number of cars sold. 3. To understand better, Maruti has to sell 119 cars (per every 100 cars sold in the market) to break even in Revenue terms. Below is the list with number of cars, every manufacturer have to sell, per 100 cars sold in the market. Number of Cars, to be sold, per 100 cars, in order to break even in revenue terms: Maruti Suzuki - 119 Hyundai - 93 M&M - 85 Toyota - 50 Tata - 112 Honda - 83 Ford - 75 Renault - 152 Jeep - 46 VW - 84 Skoda - 45 Datsun - 204 Nissan - 106 Fiat - 100 3. The Sales Volume has fallen by 3.81% this month when compared to last month, and the Sales Revenue has fallen by 4.03%. P.S.: Please note the revenues for the 3 Germans, JLR, Volvo, Porsche and other Luxury car makers are not included, who may have more revenue market share when compared to their minimal volume market share. For example, Mercedes Benz's revenue might be close to VW's revenue or may be more than that and this might have some impact in the actual revenue calculations. But, we do not have the individual numbers of the Luxury cars to do the calculation. Full Chart for your perusal:  |
|
| (3)
Thanks
|
| The following 3 BHPians Thank jpcoolguy for this useful post: | blackwasp, giri1.8, Overlander |
|
24th September 2018, 17:06
| #26 |
| BHPian Join Date: Jan 2016 Location: Chennai
Posts: 615
Thanked: 1,542 Times
| Re: Revenue calculation of cars sold in India - How many $$$ each model brings to its maker Revenue Calculation data for last month sales - Aug '18. Top 25 Cars based on Revenue (calculated based on 75th Percentile of the Avg. Ex-Showroom Price): 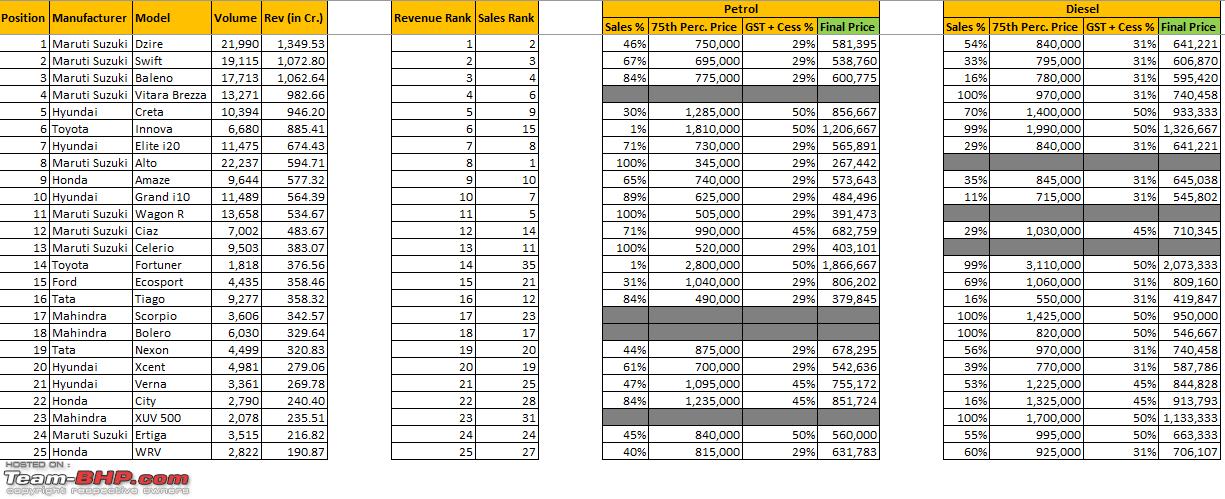 1. Very profitable month for the market leader, as 3 models are in the 1,000 Crore club - Dzire, Swift and Baleno. 2. Brezza and Creta are almost there and Innova Crysta not far behind and they slot in the 4, 5, 6 positions in that order respectively. 3. i20, Alto, Amaze and Grand i10 completes the remaining Top 10 positions. 4. Maruti Suzuki has 5 cars in Top 10, Hyundai has 3 and Toyota and Honda has Innova and Amaze respectively. Just outside of Top 10, the first 3 positions are again being occupied by the cars from the market leader - Wagon R, Ciaz and Celerio. 5. In Top 25 positions, Maruti Suzuki has 9 cars, followed by Hyundai with 5 cars, M&M and Honda with 3 cars each, Toyota and Tata with 2 cars each and Ford has Ecosport. No Renault cars in Top-25, which is one of the major players in the market. 6. Ecosport is the highest ranking car (at 15) for Ford, Tiago (at 16) for Tata, Scorpio (at 17) for M&M, Kwid (at 27) for Renault, Compass (at 28) for Jeep, Polo (at 36) for VW, Rapid (at 43) for Skoda, Redi-Go (at 48) for Datsun, Micra (at 66) for Nissan and Punto (at 78) for Fiat. 7. Eeco (16 / 26), Kwid (18 / 27), Omni (13 / 29) and Eon (22 / 35) from the Top-25 based on sales volume have moved out of the Top-25 chart based on sales revenue. They are replaced by Fortuner (35 / 14), City (28 / 22), XUV 500 (31 / 23) and WR-V (27 / 25) - note that the first value within brackets denotes the Volume rank and the second value denotes the corresponding Revenue rank. Top 25 Cars based on Sales Volume (and their corresponding Revenue rank):  OEM's Volume Market Share Vs Revenue Market Share:  1. Due to their dependency on smaller cars, Maruti Suzuki's revenue market share is approx. 8% lesser than their volume market share. In terms of Ratio of revenue per number of cars sold - Maruti has a ratio of 0.84, whereas Toyota is having a ratio of 1.95 almost doubling their revenue per number of cars sold. 2. To understand better, Maruti has to sell 119 cars (per every 100 cars sold in the market) to break even in Revenue terms. Below is the list with number of cars, every manufacturer have to sell, per 100 cars sold in the market. Number of Cars, to be sold, per 100 cars, in order to break even in revenue terms: Maruti Suzuki - 119 Hyundai - 94 Toyota - 51 M&M - 80 Honda - 89 Tata - 111 Ford - 76 Renault - 156 VW - 83 Jeep - 45 Skoda - 49 Datsun - 196 Nissan - 104 Fiat - 112 3. Renault, Datsun, Tata & Nissan are the manufacturers other than Maruti to see a fall in terms of Revenue Market Share compared to the Volume Market Share - as expected, due to their larger pie of volume coming from the small cars. P.S.: Please note the revenues for the 3 Germans, JLR, Volvo, Porsche and other Luxury car makers are not included, who may have more revenue market share when compared to their minimal volume market share. For example, Mercedes Benz's revenue might be close to VW's revenue or may be more than that and this might have some impact in the actual revenue calculations. But, we do not have the individual numbers of the Luxury cars to do the calculation. Full Chart for your perusal:  |
|
| (2)
Thanks
|
| The following 2 BHPians Thank jpcoolguy for this useful post: | giri1.8, neerajdan |
| |
|
9th October 2018, 18:34
| #27 |
| BHPian Join Date: Jan 2016 Location: Chennai
Posts: 615
Thanked: 1,542 Times
| Re: Revenue calculation of cars sold in India - How many $$$ each model brings to its maker Revenue Calculation data for last month sales - Sep '18. Top 25 Cars based on Revenue (calculated based on 75th Percentile of the Avg. Ex-Showroom Price):  1. All the Top 5 cars have crossed the 1,000 Crore mark this month - Dzire, Swift, Baleno, Brezza and Creta. 2. The positions from 6-8 was retained by Innova, i20 and Alto in that order respectively from last month. However, Amaze is pushed out of Top 10 and was replaced by Wagon R. 3. Maruti Suzuki has 6 cars in Top 10, Hyundai has 3 and Toyota has Innova. New Amaze and facelifted Ciaz occupy the 2 slots just outside of Top 10. 4. In Top 25 positions, Maruti Suzuki has 9 cars, followed by Hyundai with 5 cars, M&M with 4 cars and Honda, Toyota and Tata with 2 cars each and Ford has Ecosport. No Renault cars in Top-25, which is one of the major players in the market. 5. Amaze is the highest ranking car (at 11) for Honda, Bolero (at 13) for M&M, Tiago (at 17) for Tata, Ecosport (at 19) for Ford, Kwid (at 28) for Renault, Compass (at 32) for Jeep, Polo (at 39) for VW, Rapid (at 42) for Skoda, Redi-Go (at 49) for Datsun, Micra (at 68) for Nissan and Punto (at 77) for Fiat. 6. Eeco (13 / 26), Kwid (18 / 28), Eon (19 / 29) and Omni (14 / 30) from the Top-25 based on sales volume have moved out of the Top-25 chart based on sales revenue. They are replaced by Fortuner (40 / 16), Marazzo (27 / 23), City (29 / 24) and XUV 500 (33 / 25) - note that the first value within brackets denotes the Volume rank and the second value denotes the corresponding Revenue rank. Top 25 Cars based on Sales Volume (and their corresponding Revenue rank): 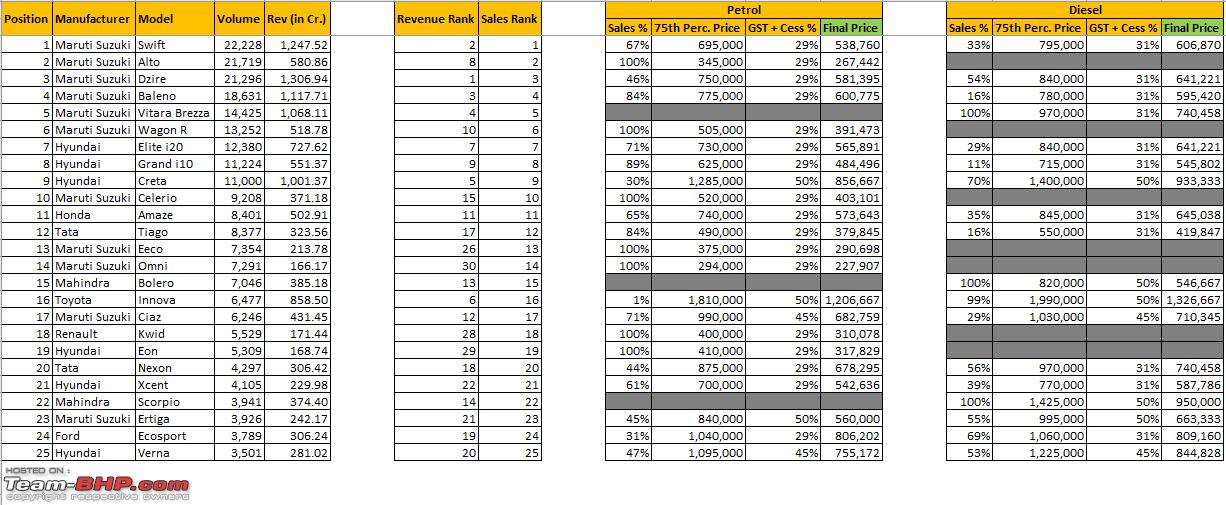 OEM's Volume Market Share Vs Revenue Market Share:  1. Due to their dependency on smaller cars, Maruti Suzuki's revenue market share is approx. 8% lesser than their volume market share. In terms of Ratio of revenue per number of cars sold - Maruti has a ratio of 0.85, whereas Toyota is having a ratio of 2.01 more than doubling their revenue per number of cars sold. 2. To understand better, Maruti has to sell 118 cars (per every 100 cars sold in the market) to break even in Revenue terms. Below is the list with number of cars, every manufacturer have to sell, per 100 cars sold in the market. Number of Cars, to be sold, per 100 cars, in order to break even in revenue terms: Maruti Suzuki - 118 (dependency on entry level cars) Hyundai - 94 (almost balanced, Creta bringing big money) Toyota - 50 (biggies like Fortuner and Innova) M&M - 80 (portfolio with larger UVs) Tata - 110 (dependency on Tiago) Honda - 88 (City saving the face) Ford - 78 (effect of Ecosport and Endeavor) Renault - 159 (one man show by Kwid) VW - 85 (effect of no entry level hatchbacks) Skoda - 50 (effect of no hatchbacks at all) Jeep - 45 Datsun - 192 (again one man show by Redi-Go) Nissan - 103 (Balanced, however no bigger volumes) Fiat - 114 3. Renault, Datsun and Tata are the manufacturers other than Maruti to see a fall in terms of Revenue Market Share compared to the Volume Market Share - as expected, due to their larger pie of volume coming from the small cars. P.S.: Please note the revenues for the 3 Germans, JLR, Volvo, Porsche and other Luxury car makers are not included, who may have more revenue market share when compared to their minimal volume market share. For example, Mercedes Benz's revenue might be close to VW's revenue or may be more than that and this might have some impact in the actual revenue calculations. But, we do not have the individual numbers of the Luxury cars to do the calculation. Full Chart for your perusal: 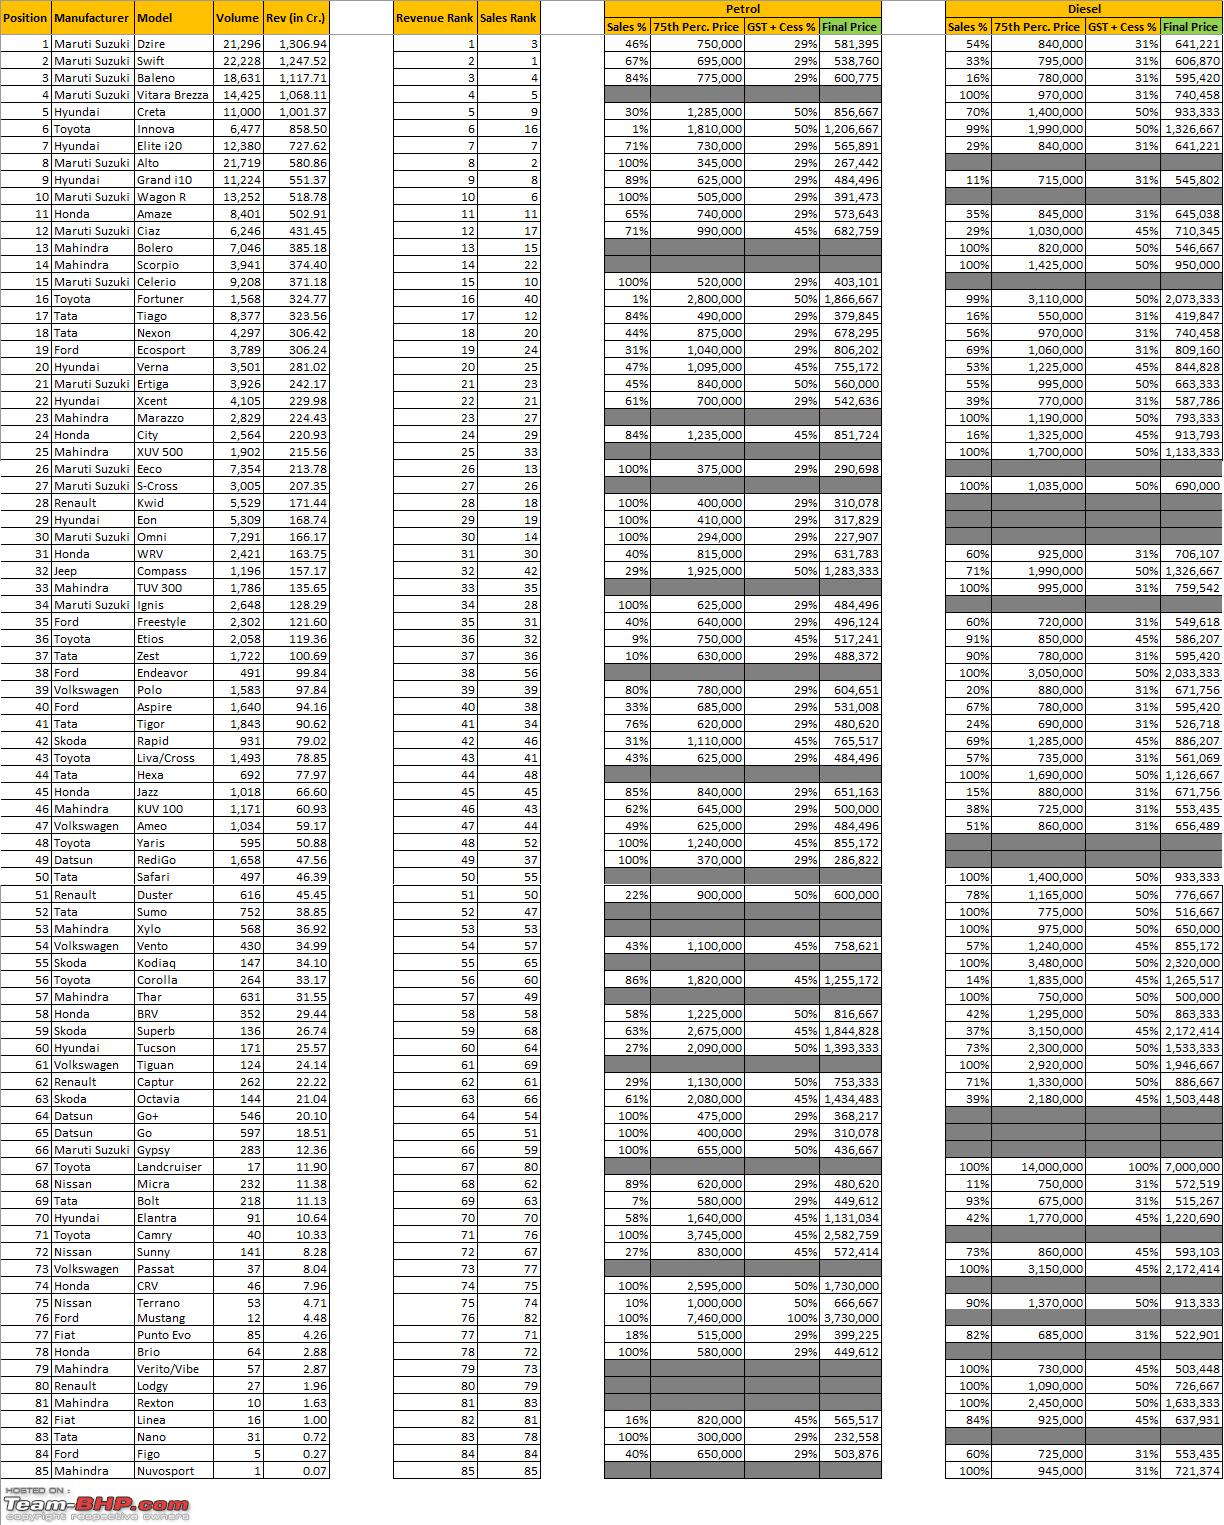 |
|
| ()
Thanks
|
|
8th November 2018, 19:15
| #28 |
| BHPian Join Date: Jan 2016 Location: Chennai
Posts: 615
Thanked: 1,542 Times
| Re: Revenue calculation of cars sold in India - How many $$$ each model brings to its maker Revenue Calculation data for last month sales - Oct '18. Top 25 Cars based on Revenue (calculated based on 75th Percentile of the Avg. Ex-Showroom Price):  1. Since, the overall car sales has decreased this month, there have been only 4 cars which crossed the 1,000 Crore mark this month - Brezza, Baleno, Dzire and Creta. Swift haven't been able to cross the 1000 crore mark this time. 2. The positions from 6-8 was again retained by Innova, i20 and Alto in that order respectively from last month. In a first, Mahindra has a vehicle in the Top 10 position, Scorpio in the 10th place just ahead of Wagon R. However, this has more to do with negative sales of Wagon R than positive sales of Scorpio. 3. Maruti Suzuki has 5 cars in Top 10, Hyundai has 3, Toyota and Mahindra has Innova and Scorpio respectively. M&M has Bolero too just outside of Top 10, in the 12th position. 4. In Top 25 positions, Maruti Suzuki has 9 cars, followed by Hyundai with 5 cars, M&M with 4 cars and Honda, Toyota and Tata with 2 cars each and Ford has Ecosport. No Renault cars in Top-25, which is one of the major players in the market. 5. Amaze is the highest ranking car (at 16) for Honda, Nexon (at 17) for Tata, Ecosport (at 18) for Ford, Kwid (at 28) for Renault, Compass (at 32) for Jeep, Rapid (at 37) for Skoda, Polo (at 39) for VW, Redi-Go (at 58) for Datsun, Micra (at 71) for Nissan and Punto (at 74) for Fiat. 6. Eeco (15 / 27), Kwid (17 / 28) and Omni (14 / 31) from the Top-25 based on sales volume have moved out of the Top-25 chart based on sales revenue. They are replaced by Fortuner (35 / 13), Verna (26 / 23) and XUV 500 (32 / 24) - note that the first value within brackets denotes the Volume rank and the second value denotes the corresponding Revenue rank. Top 25 Cars based on Sales Volume (and their corresponding Revenue rank):  OEM's Volume Market Share Vs Revenue Market Share:  1. Due to their dependency on smaller cars, Maruti Suzuki's revenue market share is approx. 8% lesser than their volume market share. In terms of Ratio of revenue per number of cars sold - Maruti has a ratio of 0.83, whereas Toyota is having a ratio of 2.03 more than doubling their revenue per number of cars sold. 2. To understand better, Maruti has to sell 121 cars (per every 100 cars sold in the market) to break even in Revenue terms and Toyota has to sell just 49 vehicles (per every 100 cars sold) in order to break even. Below is the list with number of cars, every manufacturer have to sell, per 100 cars sold in the market. Number of Cars, to be sold, per 100 cars, in order to break even in revenue terms: Maruti Suzuki - 121 (dependency on entry level cars) Hyundai - 96 (almost balanced, Creta bringing big money) M&M - 81 (portfolio with larger UVs) Toyota - 49 (biggies like Fortuner and Innova) Honda - 84 (City saving the face) Tata - 109 (dependency on Tiago) Ford - 80 (effect of Ecosport and Endeavor) Renault - 160 (one man show by Kwid) VW - 83 (effect of no entry level hatchbacks) Skoda - 51 (effect of no hatchbacks at all) Jeep - 46 Datsun - 183 (Portfolio with only entry level hatchbacks) Nissan - 109 (one man show by Micra) Fiat - 117 3. Renault and Datsun are the manufacturers other than Maruti to see a major fall in terms of Revenue Market Share compared to the Volume Market Share - as expected, due to their larger pie of volume coming from the small cars. P.S.: Please note the revenues for the 3 Germans, JLR, Volvo, Porsche and other Luxury car makers are not included, who may have more revenue market share when compared to their minimal volume market share. For example, Mercedes Benz's revenue might be close to VW's revenue or may be more than that and this might have some impact in the actual revenue calculations. But, we do not have the individual numbers of the Luxury cars to do the calculation. Full Chart for your perusal: 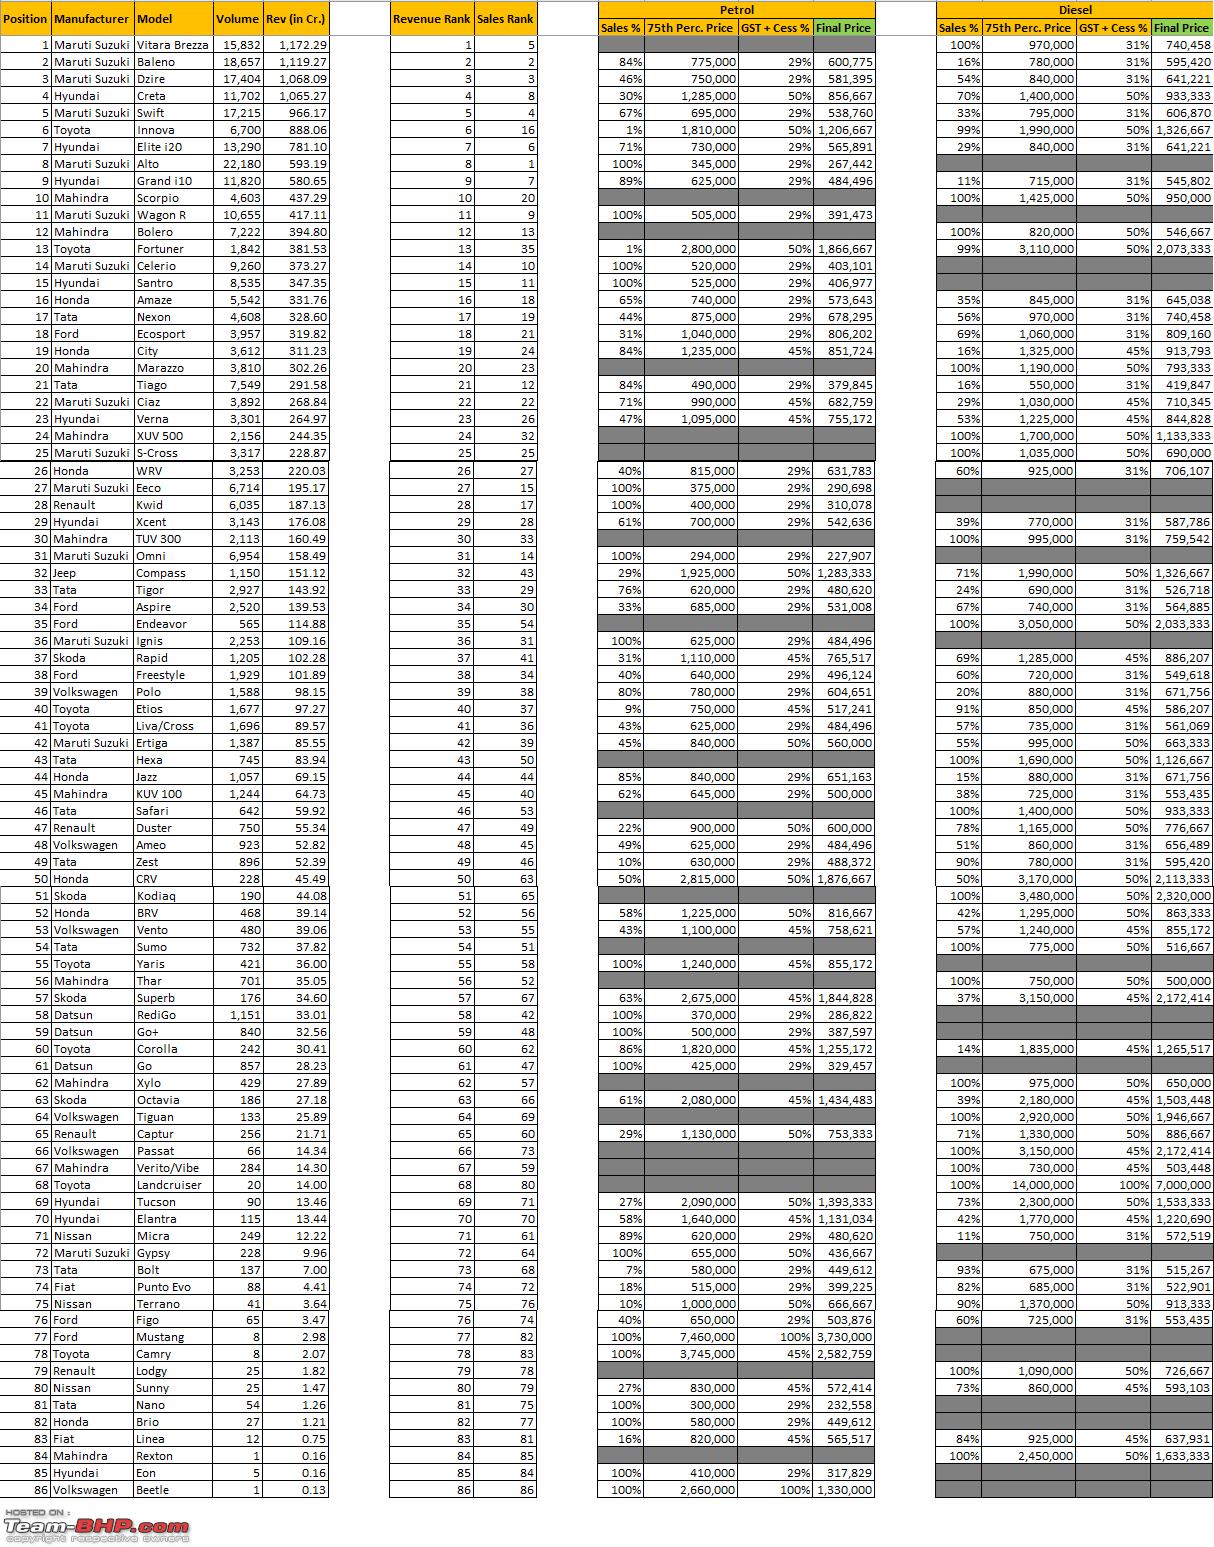 |
|
| (4)
Thanks
|
| The following 4 BHPians Thank jpcoolguy for this useful post: | blackwasp, dailydriver, mh09ad5578, YD14 |
|
7th March 2021, 11:13
| #29 | |
| Senior - BHPian Join Date: Jan 2014 Location: Bangalore
Posts: 1,634
Thanked: 4,063 Times
| Re: Revenue calculation of cars sold in India - How many $$$ each model brings to its maker Quote:
I am really keen to see the revenue ranks of the Creta/Seltos/Venue/Sonet given the higher cost + higher volumes that they seem to have now  | |
|
| (4)
Thanks
|
| The following 4 BHPians Thank vsrivatsa for this useful post: | jpcoolguy, karan85, mh09ad5578, pavanmadhini |
|
11th March 2021, 00:40
| #30 | |
| BHPian Join Date: Jan 2016 Location: Chennai
Posts: 615
Thanked: 1,542 Times
| Re: Revenue calculation of cars sold in India - How many $$$ each model brings to its maker Quote:
Once the initial set-up is done (since there was a gap of more than 2 years, need to collect the fresh ex-showroom data), this should be easily doable in the following months. | |
|
| (4)
Thanks
|
| The following 4 BHPians Thank jpcoolguy for this useful post: | CEF_Beasts, pavanmadhini, srikanthmadhava, vsrivatsa |
|