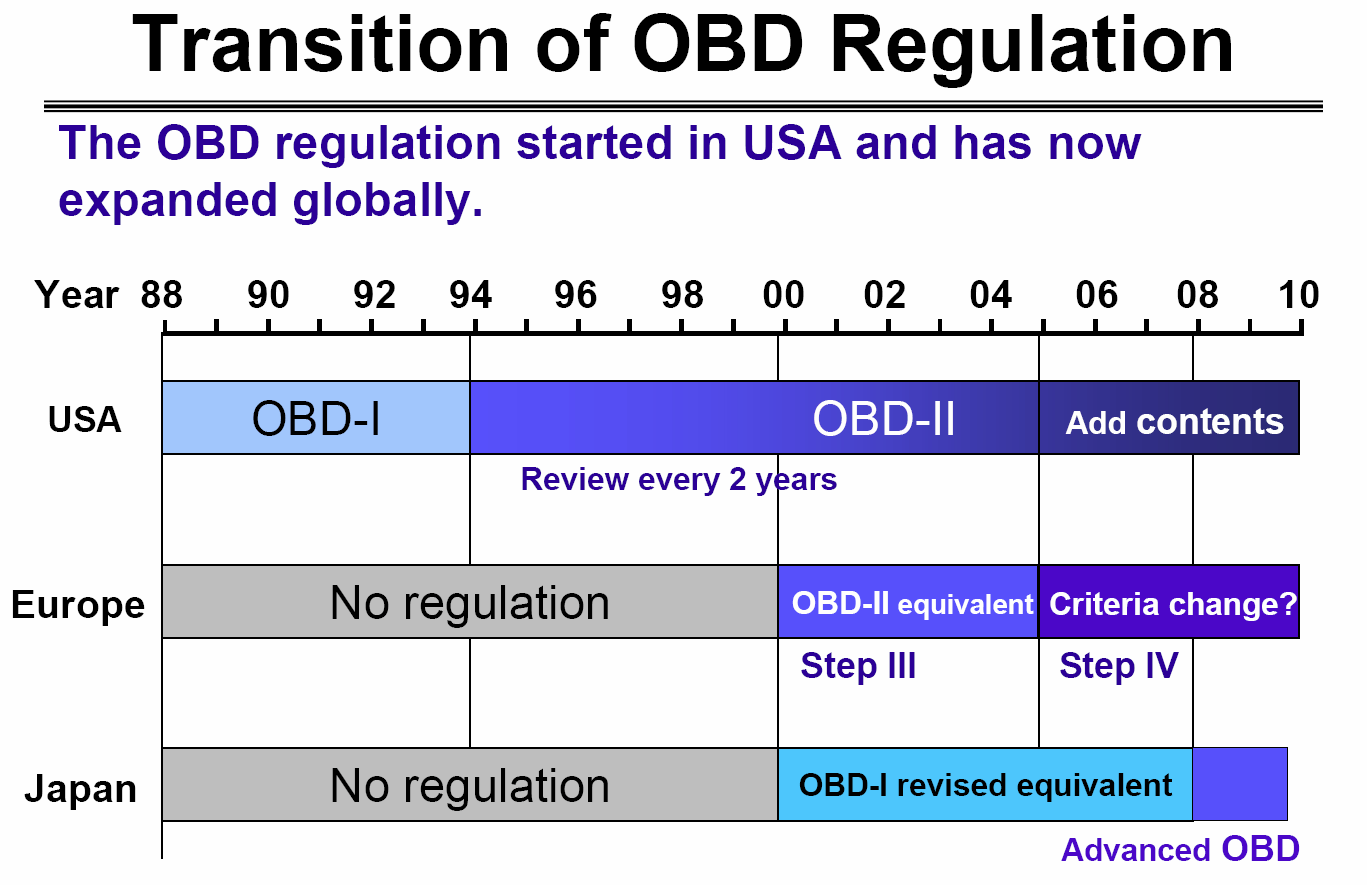
India does not go compliant by law until 2010 for OBDI and 2013 for OBDII, although many manufacturers are offerring OBDII standards. In EU its called the EOBD.
Continuous: These monitors run all the time as long as the key is turned on and/or the engine is running. There are three continuous monitors that every OBDII equipped vehicle has, they are the Comprehensive Component Monitor, The Fuel Monitor and the Misfire Monitor.
Non-Continuous: These monitors require certain conditions such as speed, acceleration/deceleration, fuel level, ambient and other conditions to be met in order for the monitor to run its testing sequence. If the specific conditions are not met, then the monitor will not perform its tests and cannot report as to whether or not there are any problems. Non-continuous monitors include the Catalyst, Heated Catalyst, Evaporative System, Secondary Air System, Air Conditioning (A/C) System, Oxygen (O2) Sensor, Heated O2 Sensor and Exhaust Gas Recirculation (EGR) System.Not all vehicles have all of these monitors. If a vehicle is not equipped or not designed with a certain monitor, that monitor is known as Unsupported.
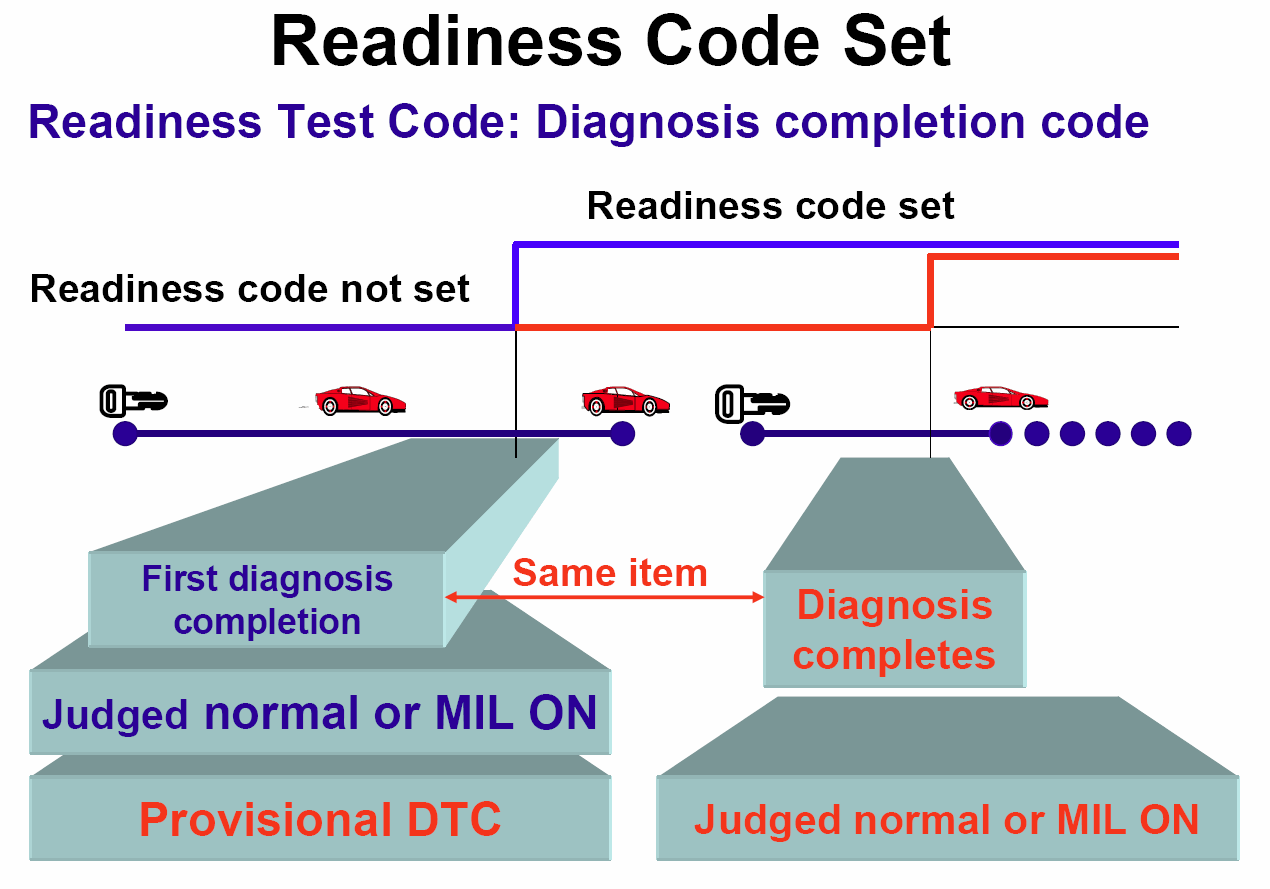
If the Drive Cycles requirements are not met, then the monitor cannot run its test. If the monitor cannot run its test, then it cannot provide a determination as to whether or not there is a problem with the components or subsystems that are tested by that monitor. In addition, there may be a malfunction(s) that could prevent the monitors from running to completion even if the drive cycle procedures are followed. In this case, the cause(s) must be identified and corrected in order for the monitor tests to be successfully completed.
Each supported monitor can be either ready or not ready.
Not all vehicles have all of these monitors. If a vehicle is not equipped with or not designed to have a certain monitor, that monitor is Unsupported.
Misfire: This monitor looks for any engine misfires. A misfire is when the air/fuel mixture in the engines cylinder does not ignite. This condition can cause damage to the vehicles engine and/or catalytic converter.
In the case of a severe misfire condition, the OBDII system will cause the Malfunction Indicator Lamp to flash indicating a serious threat of damage to the catalytic converter. In the case of a flashing Malfunction Indicator Lamp, the driver should reduce speed and seek diagnostic and repair services as soon as possible.
Fuel System: This monitor constantly checks the amount of fuel that is used by the engine. Through the use of an oxygen sensor(s), the OBDII system can determine if more or less fuel is needed. This fuel adjustment is performed many times a second and helps to maximize fuel economy and minimizes harmful emissions.
Comprehensive Components: This monitor is looking at all of the various switches and sensors that are involved with engine management. It looks for voltage readings, resistance readings, and other conditions. The monitor records readings from the vehicles components and compares them with programmed values that reflect what the readings should be. If they differ by a certain amount, then that component is determined to be suspect.
Catalytic converters: This monitor uses the readings from oxygen sensors located before and after the catalyst(s) to determine the efficiency of the catalyst.
Heated Catalyst: Some vehicles may have an electrically heated catalyst. This heater helps warm up a cold catalyst faster so that it can start working sooner which leads to earlier reduction of harmful emissions. This monitor will check to make sure that the catalyst heater is working.
Evaporative System: This monitor works to ensure that the Evaporative System is kept in a condition to minimize the release of fuel vapors.
Secondary Air System: Some vehicles are equipped with a secondary air system, or Turbo systems. The air injection system is designed to place extra oxygen into the exhaust stream to reduce exhaust pollutants. This monitor checks the components, switches, and solenoids that are part of the air injection system.
O2 (Oxygen) Sensor: The O2 Sensor Monitor watches for the performance of the vehicles oxygen sensors. Oxygen sensors are used to fine tune the amount of fuel that is used by the engine. These adjustments are made several times a second and have a direct impact on fuel economy and emissions reductions. When an oxygen sensor goes bad, the vehicle will usually begin to use more fuel than it needs to, thereby increasing the amount of harmful emissions.
Heated O2 (Oxygen) Sensor: Some oxygen sensors include an electric heater to help them warm up quicker and to begin operating faster. This monitor ensures that the heater circuit of the oxygen sensor is working properly.
EGR (Exhaust Gas Recirculation) System: Many vehicles are equipped with an EGR system. This emissions control system is designed to reduce nitric oxide tailpipe emissions by reducing the temperature inside the engines combustion chamber. This monitor checks the components of the EGR system to ensure that it is working properly and that there is sufficient flow of exhaust gas through the system.ECU Diagnostics
Boost Control
Primary & Secondary Control
Wastegate solenoid valve duty cycles. Primary and secondary refers to whether it is the wastegate duty for the first or second turbo charger. If the vehicle only has one turbo, this will be primary control.
The higher the duty cycle the more pressurised air is bled away from the diaphragm of the wastegate actuator. The spring opposing the diaphragm forces the wastegate to close. This forces more exhaust gases to pass through the turbine - more duty encourages higher boost pressures.
Low duty restricts boost by allowing the pressurised air to act on the diaphragm, pushing open the wastegate, allowing exhaust gases to bypass the turbine.
If the duty cycle is 0%, do not expect that the boost pressure will be 0 PSI. Under light loads, the boost will be negative (partial vacumm). Also at heavy loads, even if the duty cycle is zero, the boost pressure must overcome the spring tension actin on the wastegate diaphragm before any exhaust gases can pass around the turbo (through the wastegate). In practice, this means that you may see several PSI of boost (perhaps 8-10PSI) even with no solenoid activity.
Atmospheric Pressure
At sea level, this should be around a bar or 14.5 PSI. On some vehicles, the value is not updated continuously, since a single pressure sensor is shared for reading both manifold and atmospheric pressures, a solenoid being using to switch the input to the sensor.
Manifold Absolute & Relative Pressure
This is boost pressure, and may be represented as absolute or relative, depending on the ECU - some ECUs report both parameters, whilst some only report one. Absolute pressure in the manifold is relative to a vacuum. Subtract approx 14.5 PSI to get relative pressure. When boost pressure in the manifold is shown as relative to atmospheric pressure, negative values represent partial vacuums in the manifold.
Intake Air Temperature
Temperature of air drawn into the engine for combustion. Generally measured at the point of entry to the air filter. This will not give an indication of charge temperature. However intake temperature is useful to the ECU for determination of the wastegate duty cycle required to produce a given boost pressure. High boost pressures may be attained with lower wastegate duty cycles when the IAT is low.When people discuss boost pressures, they are generally referring to manifold relative pressure. For vehicles running high boost, it is better to view manifold absolute pressure due to the way in which the data is reported: for eg in Subaru vehicles the manifold relative pressure parameter can only report pressures up to around 19 PSI. Beyond this pressure, the ECU will just report 19 PSI.
Injector Milliseconds
Number of milliseconds that each injector is open for for each cylinder cycle (2 revolutions of the crank). To calculate injector duty cycle: Duty Cycle % = RPM * 'Injector ms' / 1200.
If you are regularly seeing over 90% duty, you may need bigger injectors. The injectors must have enough 'head room' too cope with unexpectedly high air flows - these may be caused by overboost, faults and particularly cold weather.
A/F Sensor #1 Current & Resistance
These parameters show the current passing through the front air/fuel sensor and the sensor's resistance. These are inputs used to calculate front sensor air/fuel ratio.
A/F Sensor #1
Displays the air fuel ratio as determined by the front air/fuel sensor. This sensor is in close proximity to the engine exhaust ports and is before any catalytic converters. When running on closed loop fuelling control, this sensor provides the main feedback for optimizing fuelling. This parameter reports an air/fuel ratio as opposed to a simple rich/lean signal.
A/F Correction #1
Short term correction percentage applied to fuelling based on the output of the front air/fuel sensor.
A/F Correction #3
Short term correction percentage applied to fuelling based on the output of the rear O2 sensor. This sensor is after any catalytic converters and helps to fine tune the fuel mixture to minimise emissions.
A/F Learning #1
Long term correction percentage applied to fuelling based on feedback from front and rear sensors.
Front & Rear O2 Sensors
These parameters report the output voltage of the O2 sensors. Early vehicles tend to have a single 'Front O2 Sensor', whereas newer vehicles have both a 'Front A/F Sensor' and a 'Rear O2 Sensor'. These sensors do not report an accurate air/fuel ratio, but instead provide a rich/lean signal to the ECU.
Their output voltages switches sharply as the AFR crosses the stoichiometric ratio. Values of approx 0 to 0.9 Volts are normal. 0 being lean, 0.9 being very rich. The sensor voltage will oscillate between these extremes when under closed loop control. Under high loads, the voltage should never drop below 0.7 Volts. If it does, this means that the fuel mixture is too lean when on boost. Quite possibly there is a fault with the air flow sensor.
The addition of cone style induction kits, whilst improving top end power and throttle response is known to upset air/fuel ratios. Alteration of the ecu calibration (AKA a remap) is the solution.
Exhaust Gas Temperature
Reports the temperature of exhaust gases on more recent cars. Some sensors are not capable of low temperature readings, so it is normal to see a value of 200 degrees with the engine off. This is not a fault. The EGT sensor is placed after the up-pipe catalytic converter and allows the ECU to monitor the temperature of this 'cat'.
It is important for the ECU to regulate the temperature of the cat: If the temperature is too low, the cat will not perform efficiently. If the temperature is too high, the cat may be damaged, pieces may break away potentially destroying the turbo in the process. This is the reason for the EGT sensor and trouble code display.
Fuel Level Sensor
Reports the output voltage of the fuel level sensor.
Fuel Tank Pressure Signal
Reports the pressure present in the fuel tank.Comments on Air Fuel Correction
Ignition Timing
Overall ignition timing that the engine is currently running, incorporating the knock correction component described below.
Knock Correction
The number of degrees added or subtracted from the ignition timing based on the amount of knock detected. Positive values are ignition advance (due to the absence of knock). Negative values are ignition retard (due to the presence of knock). These ECUs run active knock correction, and it is quite normal to see -3 to + 12 degrees of correction.
Maximum power is produced on the point of knock beginning, and the sensor is there to keep the timing 'on the edge'. Some ECUs run more aggressive knock correction than others. E.g. 1999/2000 model year turbo ECUs only run 1-2 degree positive values, whereas 2001-2003 ECUs may run much more than this.Variable Valve Timing
VVT Advance Angle Left & Right
Reports the amount of intake cam advance applied. There are two parameters - left & right - because two separate mechanical systems control the valve timing for the left & right sides of the flat-four engine.
The higher the advance angle, the earlier the intake valves open - this causes more intake/exhaust valve overlap which can help the engine to breath more efficiently at particular RPMs and loads. It is normal to see small differences between left and right sides of the engine. Large, continuous differences may indicate a fault.
Oil Control Valve Duty Left & Right
The oil control valves control the VVT advance angles. The values are a duty percentage, indicating the proportion of time that the valves are energised.
Oil Control Valve Duty Current Left & Right
Reports the current passing through the oil control valve solenoids.
TGV Position Sensor Right & Left reports the output voltage of the tumble generator valve position sensors.General Vehicle Systems
Battery Voltage
Measured voltage from the car battery. May be as low as 10 Volts when ignition is off. Should rise to around 14-15 Volts when the engine is running.
Coolant Temperature
Temperature in Centigrade of the cooling water. Expect to see around 85 - 95 from a warmed up engine. The engine should work too hard until the temperature is at least 80 degrees.
Engine Speed
Speed of rotation of the engine in revolutions per minute.
Vehicle Speed
Speed of wheel rotation in kilometres per hour for standard wheel circumference. Data value may not be updated as frequently as engine speed, hence acceleration times may be more accurately determined from engine speed. This value may not be accurate if the car wheels or tyres have been changed from standard, since this changes the rolling circumference.
Mass Air Flow / Air Flow Sensor Voltage
The rate of flow of air into the engine. Some ECUs report air flow voltage, whilst others report a calculated flow rate. The voltage from which the ecu calculates mass air flow is non-linear, with smaller changes in output voltage being seen for flow changes at high rates compared with low flow rates. It is from mass air flow that the ECU calculates engine load which has a big influence on ignition timing and fuelling.
Throttle Opening Angle/Sensor Voltage
Displays state of the throttle. High voltage or % value means a more open throttle. When logging engine activity (especially on the dyno), it is useful to log throttle position. This makes it easy to see when a power run begins and ends i.e. when the driver's foot is depressing the accelerator fully. There may be more than one throttle parameter.
Accelerator Sensor Voltage
Present on fly-by-wire engines where there is no direct link between the accelerator pedal and throttle butterfly. This parameter reports the voltage measured on the accelerator pedal sensor. There may be more then one accelerator sensor parameter.
Idle Speed Control Valve
Controls the amount of air let into the manifold when the engine is idling. It is normal to see this value fluctuating slightly with lambda on idle. Switching on the air-conditioning or headlights will also cause this value to change slightly.
Alternator Duty
On some cars, the alternator duty may be controlled by the ECU. This allows the load on the engine from the alternator to be controlled. E.g. The ECU may reduce the alternator load at high engine loads, in order to reduce the power drawn from the engine. This results in slightly more power being put down on the road.
A typical boost control map is an 8 by 8 grid of numbers. The rows represent RPM, whilst the colums represent engine load. The values in this grid are the desired boost pressures. Many times per second, the ecu will check the current engine RPM and engine load, and will look up the boost pressure that it should try to maintain. In the example above, each row in the grid might represent 1000 RPM steps, the 8 steps being equivalent to 1000, 2000, 3000, 4000, 5000, 6000, 7000 & 8000 RPM.
An 8 by 8 grid will contain 64 values, but this does not mean that only one of those values may be chosen. The ECU uses a method called 'interpolation' to calculate values that lie in between the values in the grid. For example, a map may contain entries for 1000 (say 10PSI) & 2000 RPM (say 11PSI), whilst the engine is actually sitting at 1600 RPM.
The ECU will take the two values and 'draw a line between them'. It then travels along that line until it gets to the required RPM values. This interpolated value is what it will use, and in this case would be 10.6 PSI. (This is only a simple example of how 1-dimensional interpolation works. On a 2-d map, the interpolation must be done in 2 dimensions).
Whilst interpolation greatly increases the accuracy of values retrieved from a map, it is no substitute for a larger map. The larger (X by Y) a map is, the closer all guessed values will be to a 'real' map value.The more rows and columns that a map has, the finer the control over that engine parameter. Ignition and fuelling maps in the Impreza ECU are 16 by 16.
Scaling Maps
Scaling maps allow finer engine control in the areas where it is needed most. Many ECUs do not use scaling maps at all as in the simple example above.
Let's see how a scaling map might apply to boost control. For the majority of the rev range, the desired boost pressure will be the same. However, in the low and high extremes of the range, finer control may be required. This is where a scaling map can help.
Taking the previous example: There are 8 RPM zones at equally spaced 1000 RPM intervals. Fine control over boost may be needed between 500-2500 and 6000-7000 RPM, with the mid range boost being constant. A scaling map allows you to specify the row headings, so to speak - it allows you to space the rows in the main map unequally across the rev range. So instead of fixed 1000 RPM intervals, as an example you could have 750, 1250, 1750, 2500, 3000, 6000, 6500, 7000 RPM - that's still 8 zones, but used where you need them most. Interpolation takes care of the wide gaps, and you get the resolution where you need it.
Reasons for Active Ignition Timing
An ignition timing system has to balance a number of sometimes opposing objectives - vehicle emissions, engine power output, fuel consumption & engine longevity.
An active ignition timing system allows continuous adjustment of ignition timing in order to best meet requirements. What makes the system 'active' is its ability to detect engine knock via the knock sensor attached to the engine block.
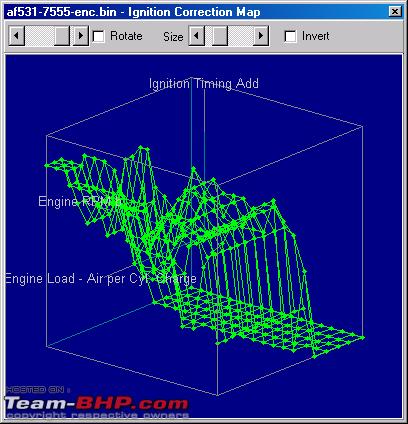
Ignition Timing Maps
Base Ignition Timing
Ignition Advance Map
The maps above are from a 2002 UK WRX Impreza. These maps form the basis of the ignition timing functions of the ECU.
Ignition Base Map
The base ignition timing map holds the timing values to be used with the lowest octane fuel that the engine will encounter. This is (hopefully) the most retarded timing that the engine will ever need to run in normal circumstances.
Most base ignition maps have the same approximate shape. As engine RPM increases, ignition advance increases. As engine load increases, ignition timing retards. As a result, the most advance is used at high revs and low load, whilst the least advance is used at high loads and low revs.
The ignition timing flattens off at high RPMs. This is because the ECU does not use the knock sensor beyond around 6000rpm(for Impreza). This is for a very good reason - it is difficult to differentiate between knock and engine noise at high load and revs. Because of this, the ECU uses 'safe' timing values after the knock sensor switches off.
Ignition Advance Map
The ignition advance map holds the timing values that may be added on top of the base map should the ECU decide to do so. The values are set so that base plus correction map values total the timing that should be used with the highest octane fuel that the engine will encounter. The ECU will never advance timing beyond the base plus correction lookups.
At low engine loads, the ignition advance map contains no advance - this is the flat 'valley' of the map. No matter what the quality of fuel, the ECU will never advance the timing above the value in the base map. This is because the engine will not produce further power by advancing the timing - MBT (minimum best timing) has been reached. Advancing the timing further increases the chance of knock and also increases vehicles emissions of hydrocarbons and NOx.
MBT is the lowest value of ignition advance that produces maximum power.
At high engine loads, the advance map contains much larger values. This shows that the timing possible varies greatly with the octane of fuel being used. Under boost, it may not be possible to reach MBT.In other words, the more timing advance that can be run, the higher the engine power output produced - MBT cannot be reached before the engine begins to knock before the plateau is reached. This is where the active ignition timing excels - it allows the ECU to run the highest timing possible without engine knock.
The below learnt ignition correction tables show the learnt ignition timing that the ECU has developed based on feedback from the knock sensor.Coarse Ignition LearningWhen the grade of fuel is unknown, the ECU starts by running timing for a medium octane fuel. I.e. Values from the base map plus half of values from the advance maps. The ECU will then listen for knock. Based on its presence or absence, the ECU will then slowly decrease or increase the proportion of the advance map which is added to the base map until the level of knock is at a safe level. Its goal is to add the highest proportion of the advance map wherever possible. It is the number of sixteenths of the advance map that the ECU is willing to use - 16 being good, 8 being neutral and 0 being very bad.Criteria for learning Ignition learning as does not happen all the time , the ECU must fulfill certain criteria, such as coolant temperature, engine speed and load before learning with occur. Some fault codes will also inhibit or completely disable ignition learning, so they should be checked for before tuning begins.The state of the advance multiplier determines the coarse ignition correction to be used across the entire load and rev range. Obviously this may not be optimal, since it may be better to run slightly more timing in some areas, and slightly less timing in others - this is where fine learning comes into play.Fine Ignition LearningOnce an overall (coarse) ignition learning factor has been determined, the ECU begins to fine tune the timing. In contrast to the single blanket value of coarse ignition correction, the fine correction is stored as an 8x8 table totalling 64 values. This allows the ECU to tailor the timing in 64 separate areas of load and rpm. However, if the ECU is given sufficiently good quality fuel, the advance multiplier will hit its maximum value of 16 and will therefore use the full value from the correction map i.e. once the correction map hits its end stops, it is not possible to advance the timing further using fine learning (unless the ECU is reset again).
Ignition Learning after ECU Reset
Ignition Learning after DrivingThe first picture shows the 'default' state after an ECU reset and before the car has been driven. The second picture shows learnt timing on another ECU on some very low octane fuel after a few minutes of driving.
|
Originally Posted by ph03n!x
(Post 898234)
Wonderful!! I kind of understood the concept of OBD & the complete purpose of having an ECU. And I got a question though. How does a performance tuner kit - like a Pete's box - modify the parameters in the ECU to deliver better performance? |
|
Originally Posted by dadu
(Post 898342)
Tuning is a vast area and can be done in many ways and for almost all vehicles which follow an OBD standard (easier to decode the ECU). |
|
Originally Posted by dadu
(Post 898342)
But specific to your question, Pete's powerbox works in conjunction with the original ECU(intercepting it's signals and sending back altered ones), with pre-calculated increase in the diesel fuel injected quantity for the full RPM range of the vehicle. Remember that Pete's powerbox does not change your car's max speed, it just helps you to reach it faster by providing optimum torque and power. What exactly Pete's Tuning box(popular in the forum) does is, to intercept the fueling signals being sent from the Original ECU to the fuel pump and read them. It then uses these 'read values' to look up the new values to be sent to the fuel pump in realtime and also sending misleading information to the original ECU (to push more), they know this from the pre-programmed fuel map already stored inside the Power Box, which Pete's technical team would have already tested during their R&D for best power and Torque for a particular model. So Pete's doesn't modify any parameters in the ECU but misleads them. Thats why Pete's only sell for certain models only, since they need to understand the MAP of that model before coming out with a box and also determine if the engine is capable of tolerating that strain. |
| All times are GMT +5.5. The time now is 15:43. |