News
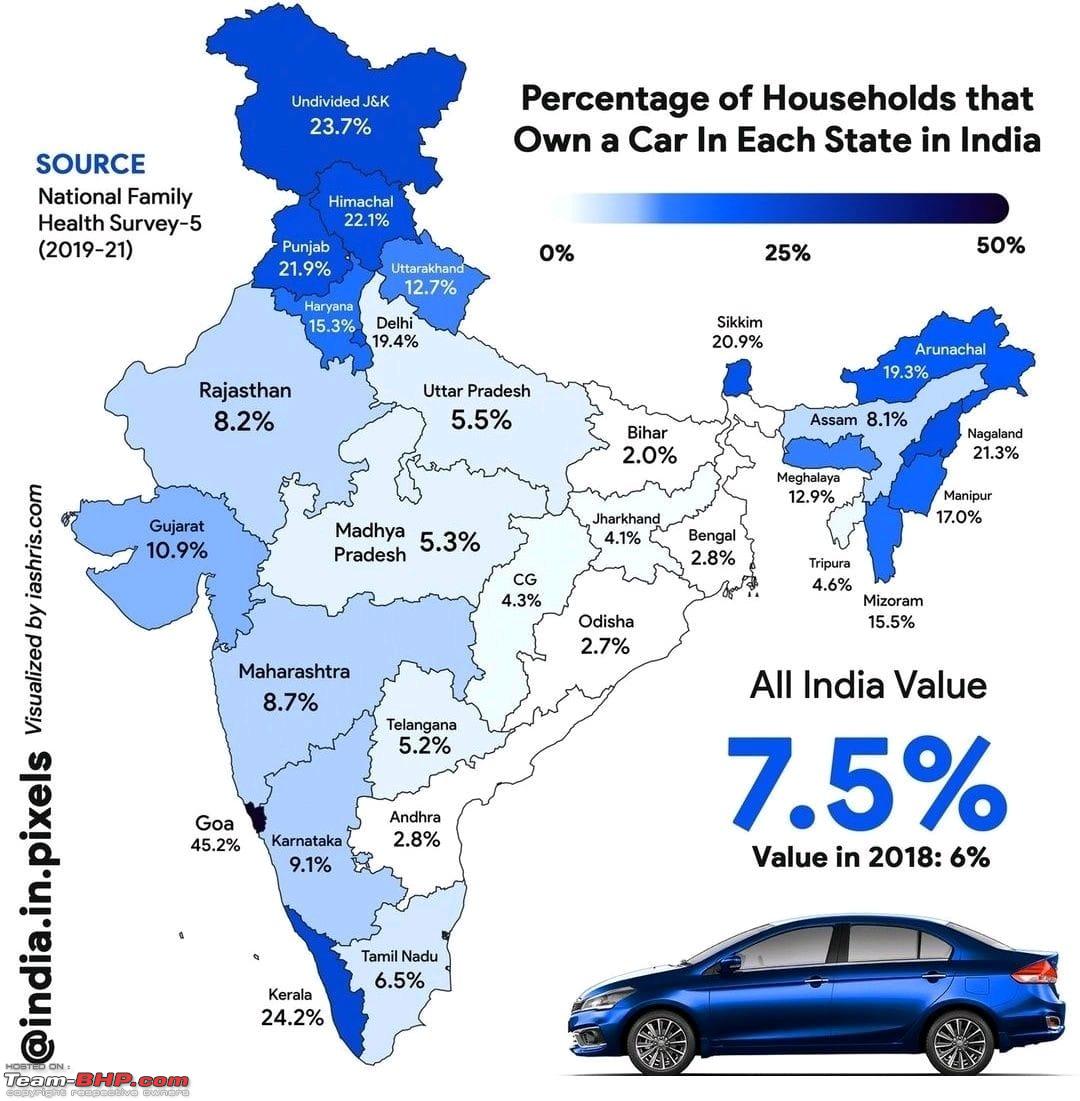
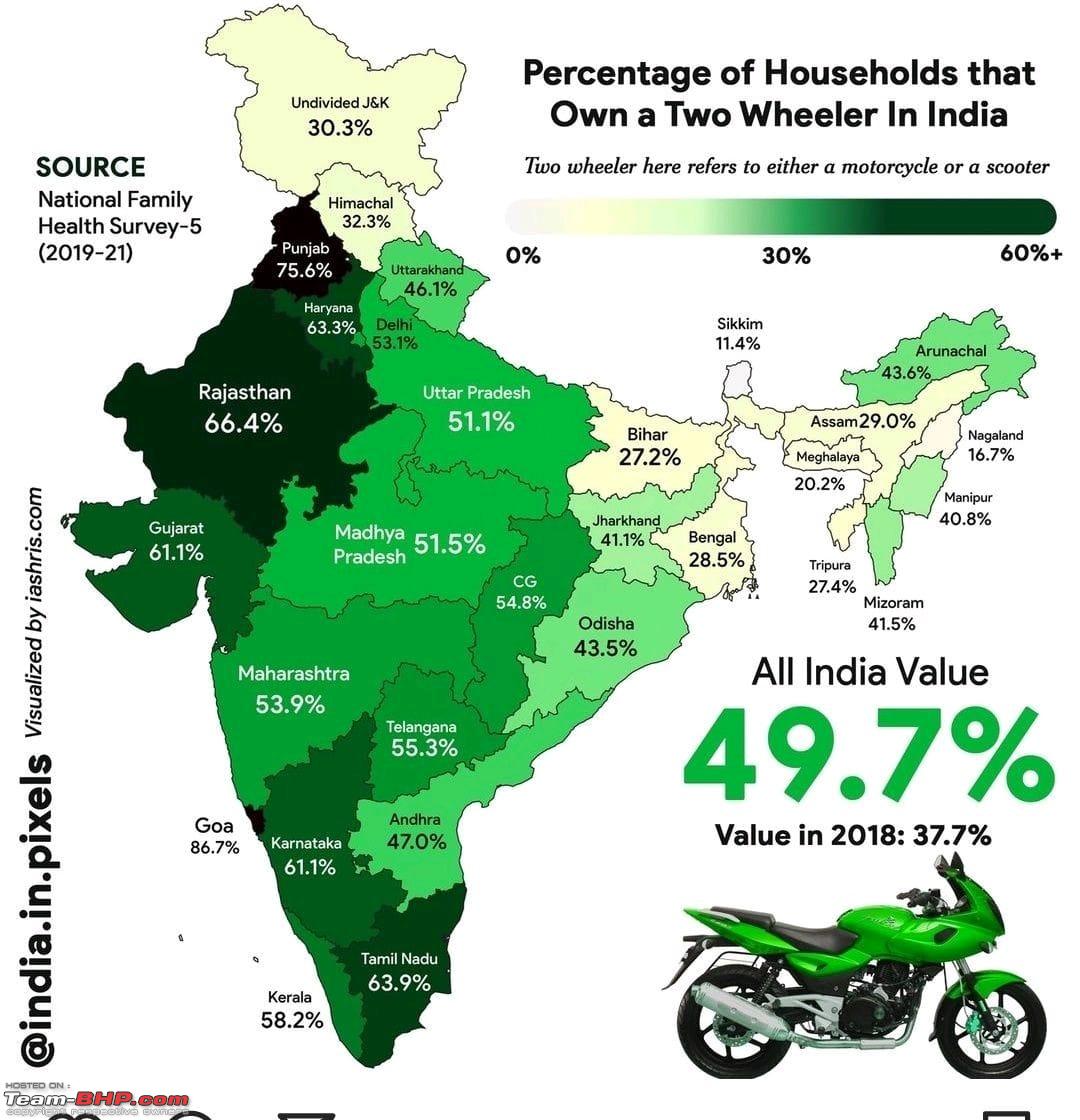
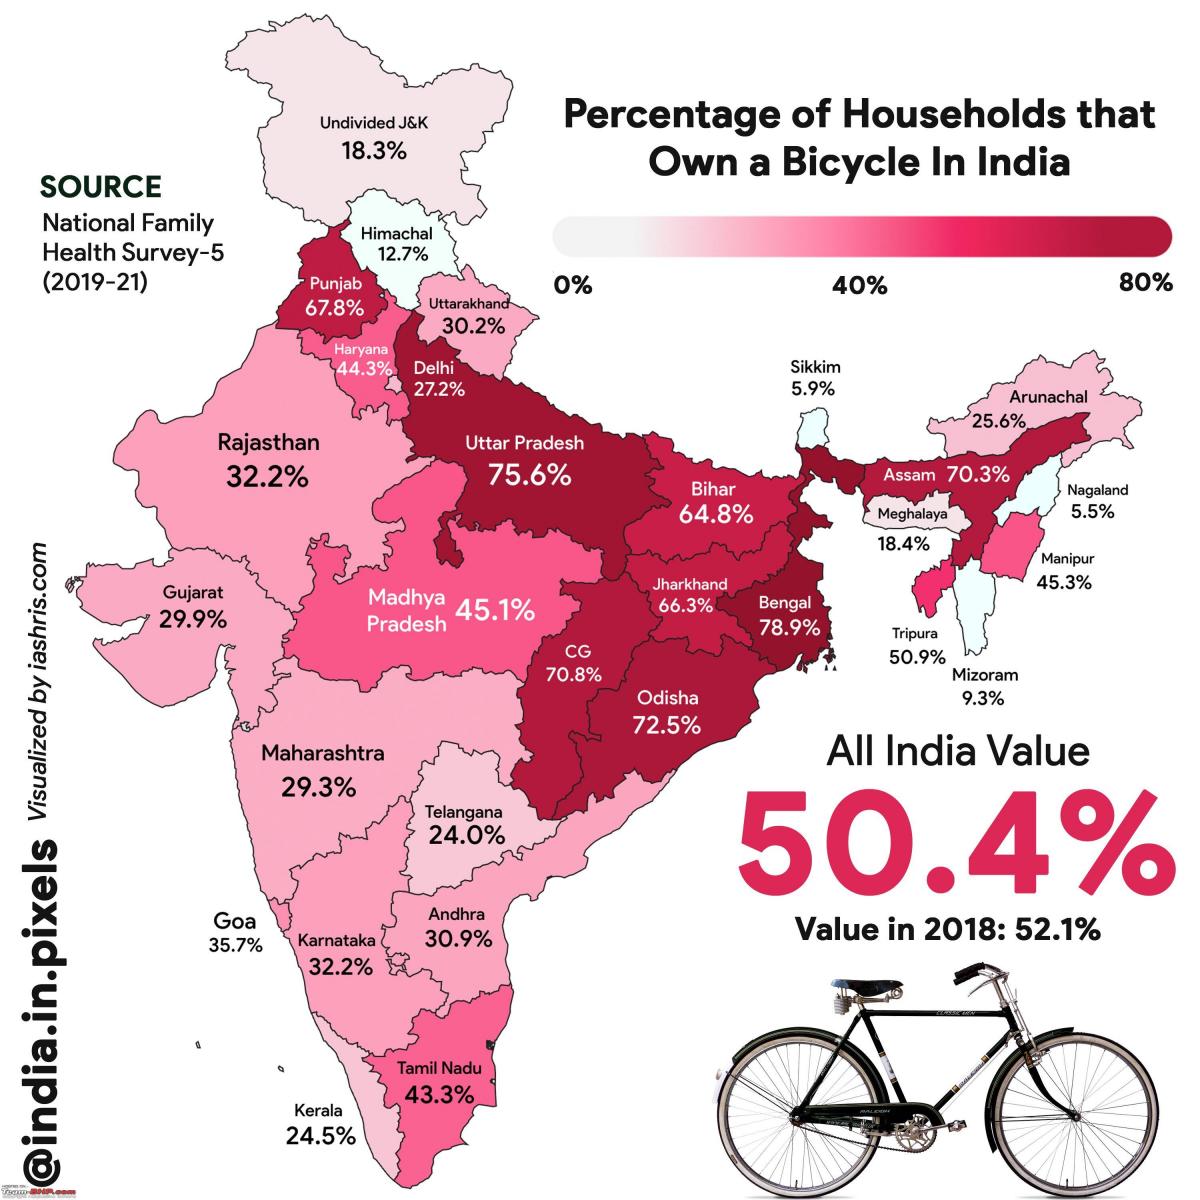
Indian states with the highest percentage of car/bike ownership

The number of cars/bikes owned in a household is ignored. As long as a household owns a single car or bike, it is counted.
BHPian SmartCat recently shared this with other enthusiasts.
Rare WhatsApp forward that actually contains interesting information:
Adding my own infographic so that we can draw some conclusions - GDP per capita for each state:

The number of cars/bikes owned in a household is ignored. As long as a household owns a single car or bike, it is counted.
That is, out of a sample of 100 households, if 10 households own a car, then the percentage would be 10%. If these 10 households together own 20 cars, then the percentage would still be 10%.
Here's what BHPian ninjatalli had to say on the matter:
Interesting infographic. But the view only gives the output, not a clear view that helps understand the reasons for the numbers. While GDP per capita might be one of the underlying factors for the split of car & 2-wheeler ownership in certain states (e.g. Punjab & Haryana, Goa, etc.), there are other factors in play that apply to other states too.
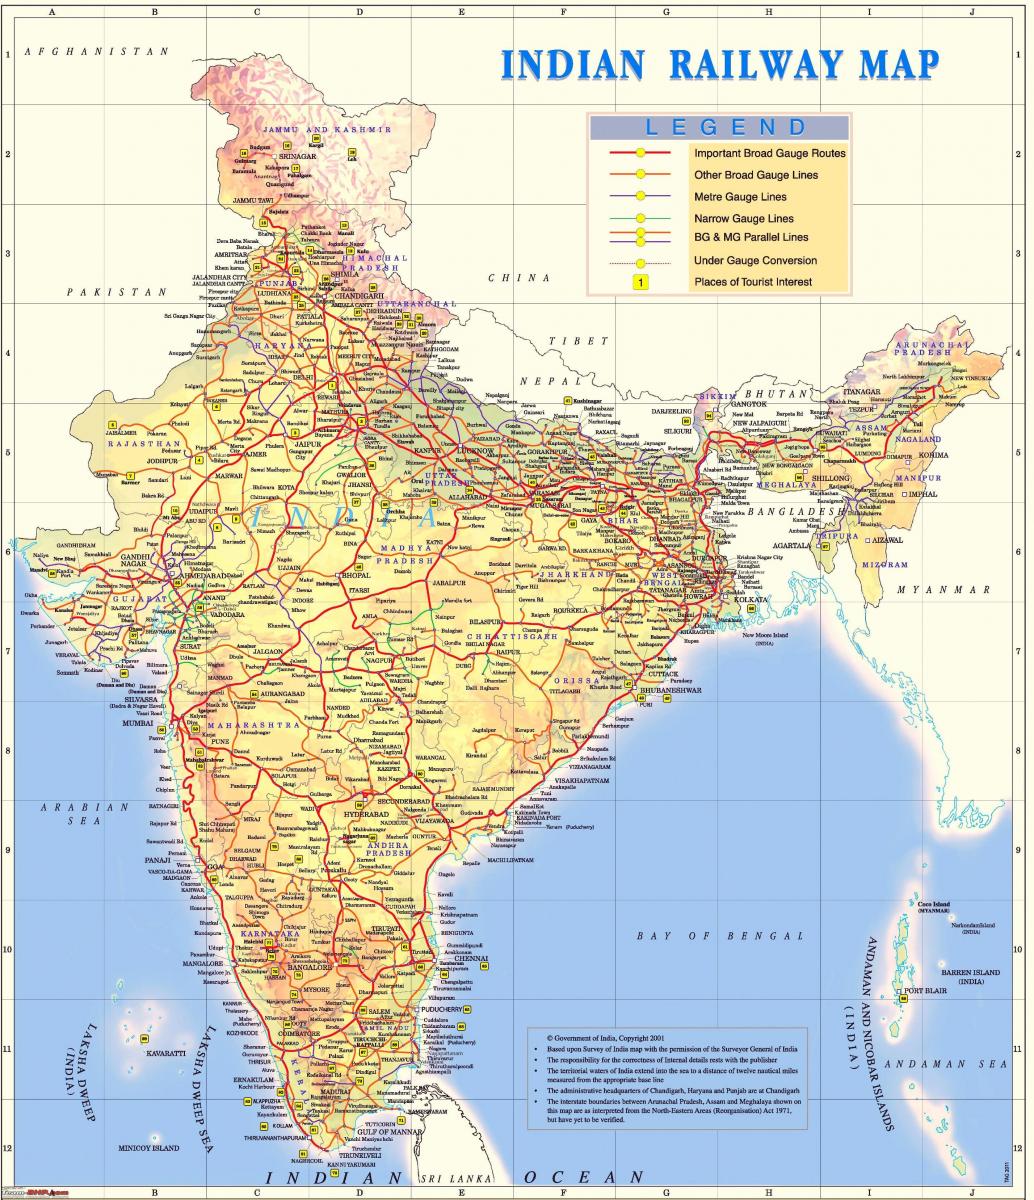
Here's an Indian railway coverage map. Very clearly some states have low railway coverage/density. That might answer (to an extent) the easy question of why certain border states are having a high car and/or 2-wheeler ownership:
- J&K
- NE states (Arunachal Pradesh, Manipur, Nagaland, Mizoram, etc.)
- Sikkim
- Rajasthan
and other states that have low/moderate car and/or 2-wheeler ownership (with high railway coverage density).
- Bihar
- West Bengal
- Assam
- UP & MP
It'll be interesting to understand what other factors play a part along with all public transport coverage (incl. trains & buses) and GDP per capita.
Here's what BHPian DicKy had to say on the matter:
Was expecting the car numbers for Kerala, but the two-wheeler numbers for Kerala seem less than what I expected. Maybe if we take district-wise numbers, some districts may have a far greater number of two-wheelers owners.
The greater number of motorists is a kinda blessing in disguise. You are less likely to be seen as a bourgeois joyriding, but going about doing one's work. Parking facilities are a given in most establishments (at least newer ones), speed bumps in panchayat areas are no longer little mountains that can only be crossed by essential vehicles, and incidents of car owners being blamed outright for accidents have lessened (thanks more so to CCTVs), you are less likely to be attacked on the infamous strike/hartal/bandh day, increased tax/toll/fuel prices see more public outrage (though it doesn't stop them from being high )
On the downside, the traffic conditions are to be seen. The starved for funds government is seeing motorists more as a way to squeeze more money than as a pressure group, not just in taxes but money-grabbing in the guise of safety. For now, everything is fine. But I am expecting future Kerala to try out all the games in the book. Higher taxes, draconian rules like the NGT one in NCR, odd/even, London/SG style congestion charges. Maybe not now, but definitely in the future.
Believe the number for the Northeast states and states bordering the mountains may have more to do with poorer public transport facilities. Am more surprised at the car ownership numbers for Maharashtra and Tamilnadu.
BTW, car ownership may be relatively high in Kerala. But most of the owners are either Alto/Dzire kinda owners or used car buyers who keep them as garage queens while using two-wheelers for daily commuting. The only times the car gets out are for weekend outings, marriage functions or when it rains.
Here's what BHPian Red_Phantom had to say on the matter:
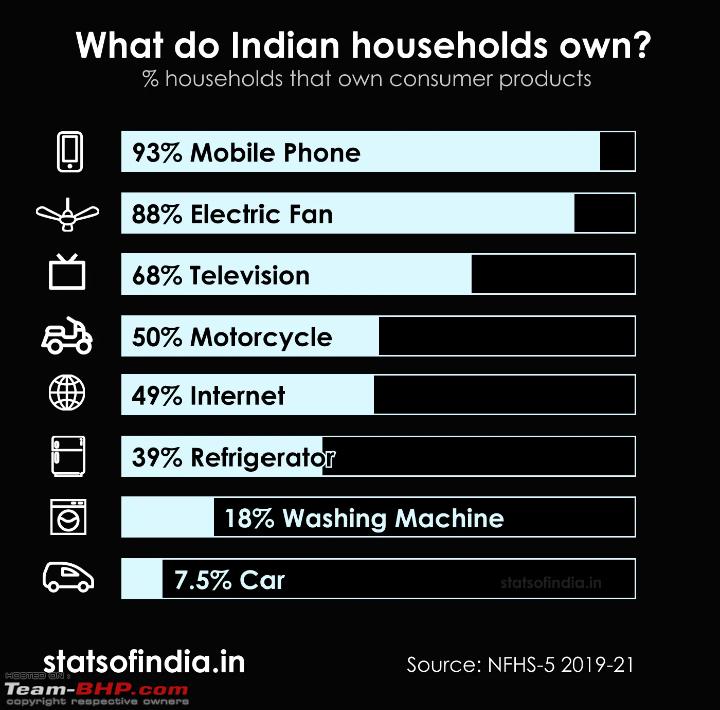
I came across this graph made by u/PratapVardhan on Reddit which he had posted on r/dataisbeautiful. It is made using the same data as this one (NFHS statistics) and shows the household usage of different appliances in India.
Here's what BHPian fhdowntheline had to say on the matter:
The % ownership should also be qualified with the actual population. So a lower % in UP may be numerically higher than say, Rajasthan. In fact, the GDP per capita infographic is also very interesting. Punjab is lower than Haryana, HP and UK, which seems contrary to the popular perception of it being a state of relative wellbeing. UP and Bihar are really worse off compared to all other states.
I think a deeper dive needs to be done to gauge rural vs urban numbers in all these areas. There one will likely see that even for a large state like Maharashtra, the numbers are highly skewed towards Mumbai, Pune, Nasik and Nagpur.
Check out BHPian comments for more insights and information.
Find Car News
Just News

.jpg)


.jpeg)

About Us

Buy & Sell
USED CARS