Team-BHP > Modifications & Accessories
Register New Topics New Posts Top Thanked Team-BHP FAQ


Reply
  Search this Thread
76,622 views
Old 11th September 2015, 17:18   #46
BHPian
 
Join Date: May 2015
Location: Bangalore
Posts: 78
Thanked: 187 Times
Re: Race Dynamics dyno database of Stock cars

Can you please add Toyota Fortuner 4X4 Information please?

Thanks.
chaith.turbo is offline  
Old 11th September 2015, 18:09   #47
BHPian
 
Join Date: Jun 2006
Location: Bangalore
Posts: 43
Thanked: 61 Times
Re: Race Dynamics dyno database of Stock cars

Quote:
Originally Posted by Racedynamics View Post
Ford Fiesta Sport 1.6s petrol

Measured power : 69 whp
Manufacturer claimed power: 101 bhp

Measured torque: 95.1 Nm
Manufacturer claimed torque: 146 Nm
Seriously shocked with these figures. That's almost 30% loss. Are you sure the car involved was in good health. Curious to know as I own one
Srinidhi is offline   (2) Thanks
Old 11th September 2015, 22:22   #48
KMT
BHPian
 
Join Date: Jan 2005
Location: Coorg
Posts: 455
Thanked: 877 Times
Re: Race Dynamics dyno database of Stock cars

Hi Racedynamics

Thank you for this.

Please can you share figures for Mahindra DI Turbo.

Either That DI, Bolero or Pikup.
You
Thank you

Last edited by KMT : 11th September 2015 at 22:24. Reason: Sorry double post
KMT is offline  
Old 11th September 2015, 22:27   #49
BHPian
 
nakul0888's Avatar
 
Join Date: Apr 2013
Location: kochi
Posts: 502
Thanked: 1,686 Times
Re: Race Dynamics dyno database of Stock cars

Quote:
I think when GTO dyno'ed his pre-worshipped Civic in stock, it was giving close to 118 whp (~10% loss in the driveline). Here, the civic is showing more like 103-104 whp. I think this could very well be dependent on the condition and years of abuse that the car has taken. I am sure a well maintained stock civic would give much more than 103-104 hp on the wheels.
I second that, I mean look at mod rehaans post. In his dyno graph, the civic easily crosses 120bhp. Surely an FFE can't give you more than 10 horses. So at stock it should be 110 plus. Btw, was that gto s civic as well?

Would have loved to see the results of vw s 1.6 tdi, fiats t jet and skodas 1.8 tsi.

Last edited by nakul0888 : 11th September 2015 at 22:32.
nakul0888 is offline  
Old 12th September 2015, 04:40   #50
Senior - BHPian
 
Nithesh_M's Avatar
 
Join Date: Oct 2014
Location: Mangalore
Posts: 1,227
Thanked: 3,248 Times
Re: Race Dynamics dyno database of Stock cars

Quite honestly its pointless to compare dyno charts of cars taken years apart from them rolling off the production line. What would be beneficial here is for an owner to get a rough estimation of what his car's performance graphs are indicating and probably hinting its state of tune to get an idea. Ofcourse every car of the same make is going to have their own range of tolerance and will obviously report different numbers, not to forget the testing conditions which include calibration of the test rig, temperature, operator, tyre pressures, etc. Realistically a Rolling road can be a great comparative tool to show differences additional components make, but in the guise of a rolling road comparisons for a one off reading they are a waste of time. A figure or power curve only shows what the car is doing on that dyno, on that day in those conditions.

Using a Rolling Road to show the difference between cars or show the increase from software can also be unrealistic without correct preparation. If you have two identical cars running the same quality fuel, tyre pressures, etc. you can still have a variable within the ECU due to differing driving styles and conditions the cars see. One car might have been used much more aggressively than the other and have a much larger correctional factor due to adaptation from excessive heat. This can vastly affect the power output of a vehicle. Something else to be aware of is after programming an ECU the car will take a certain period of driving time to adapt, this period of time is dependent on driving style and conditions.

This is why manufacturers quote crank hp coupled to an engine dynamometer at the factory. You eliminate more variables and get somewhat of an accurate picture of what the engine is doing. It won't be a 100% accurate either but it has less variables affecting than when using a rolling dyno.
Nithesh_M is offline  
Old 12th September 2015, 09:48   #51
BANNED
 
Join Date: Oct 2012
Location: Bangalore
Posts: 115
Thanked: 471 Times

Quote:
Originally Posted by AZ911 View Post
I think when GTO dyno'ed his pre-worshipped Civic in stock, it was giving close to 118 whp (~10% loss in the driveline). Here, the civic is showing more like 103-104 whp. I think this could very well be dependent on the condition and years of abuse that the car has taken. I am sure a well maintained stock civic would give much more than 103-104 hp on the wheels.

Very surprised by the bhp and whp differences for Hyundai. What does it suggest? Hyundai's engineering has successfully minimized the clutch and transmission losses?
Quote:
Originally Posted by nakul0888 View Post
I second that, I mean look at mod rehaans post. In his dyno graph, the civic easily crosses 120bhp. Surely an FFE can't give you more than 10 horses. So at stock it should be 110 plus. Btw, was that gto s civic as well?

Would have loved to see the results of vw s 1.6 tdi, fiats t jet and skodas 1.8 tsi.
On the day the RD box was installed, GTO's civic with the intake and filter did a 110whp on KS dyno, and with the RD box did a 120whp. For a bone stock civic, 105 to 109 whp seems to be the norm.

Quote:
Originally Posted by Nithesh_M View Post
Quite honestly its pointless to compare dyno charts of cars taken years apart from them rolling off the production line. What would be beneficial here is for an owner to get a rough estimation of what his car's performance graphs are indicating and probably hinting its state of tune to get an idea. Ofcourse every car of the same make is going to have their own range of tolerance and will obviously report different numbers, not to forget the testing conditions which include calibration of the test rig, temperature, operator, tyre pressures, etc. Realistically a Rolling road can be a great comparative tool to show differences additional components make, but in the guise of a rolling road comparisons for a one off reading they are a waste of time. A figure or power curve only shows what the car is doing on that dyno, on that day in those conditions.
As mentioned earlier, calibrations play a big role, hence the mention of corrected output for ambient conditions. 'A one off reading or a waste of time', perhaps you might want to explore the intent of this thread.

You might not be aware of this, but the top cars in indian motorsports are still those whose roots lie in the 80s and 90s. So there definitely is a point dynoing and comparing and building cars that have long since rolled off the assembly lines.

Well maintained and run-in engines that have clocked over 1L kms have shown power ratings within 1 to 4% of new engines of the same types.

Quote:
Using a Rolling Road to show the difference between cars or show the increase from software can also be unrealistic without correct preparation. If you have two identical cars running the same quality fuel, tyre pressures, etc. you can still have a variable within the ECU due to differing driving styles and conditions the cars see. One car might have been used much more aggressively than the other and have a much larger correctional factor due to adaptation from excessive heat. This can vastly affect the power output of a vehicle. Something else to be aware of is after programming an ECU the car will take a certain period of driving time to adapt, this period of time is dependent on driving style and conditions.
Most of the plots mentioned here are from our repository which has at least 3 to 15 cars of the same type that have been on the dyno, generating identical results in stock form. Except for the BMWs, we had just 2 examples.

Closed loop corrections and usage trims are in existence no doubt, but is grossly overestimated on the role it plays on full throttrle performance. Part throttle, closed loop areas, transients, etc. are regions where it makes a difference.


Quote:
This is why manufacturers quote crank hp coupled to an engine dynamometer at the factory. You eliminate more variables and get somewhat of an accurate picture of what the engine is doing. It won't be a 100% accurate either but it has less variables affecting than when using a rolling dyno.
Yes, although it is not uncommon for current generation ECUs to compute and deliver torque requests as required by the vehicle. Which loosely translates to torque at the wheels.

The whole point of having a rolling is to measure what is actually happening on the road, this is exactly what the driver wants to know.

Last edited by Gannu_1 : 14th September 2015 at 08:25. Reason: Back to back posts merged.
Racedynamics is offline  
Old 12th September 2015, 10:51   #52
BHPian
 
blahman's Avatar
 
Join Date: Jan 2014
Location: Bangalore
Posts: 96
Thanked: 275 Times
Re: Race Dynamics dyno database of Stock cars

Quote:
Originally Posted by AZ911 View Post
I think when GTO dyno'ed his pre-worshipped Civic in stock, it was giving close to 118 whp (~10% loss in the driveline). Here, the civic is showing more like 103-104 whp. I think this could very well be dependent on the condition and years of abuse that the car has taken. I am sure a well maintained stock civic would give much more than 103-104 hp on the wheels.

Very surprised by the bhp and whp differences for Hyundai. What does it suggest? Hyundai's engineering has successfully minimized the clutch and transmission losses?
It was my Civic on the dyno, it had run 25 thousand odd kms on the day of the dyno run.. A 2007 model and I was running K&N typhoon filters.. It was sparingly used for 7 years and I can safely say that it was well maintained.. We put it on the dyno to use it as reference before the turbo build.. So yea I don't think a stock civic can give out better numbers on the dyno
blahman is offline  
Old 12th September 2015, 12:03   #53
psn
BHPian
 
Join Date: Jan 2009
Location: Hyderabad
Posts: 91
Thanked: 175 Times
Re: Race Dynamics dyno database of Stock cars

Excellent excellent thread. Please keep going with other models also.
Just an observation. Laura AT has the older 6 speed DSG and the TSi has the latest 7 speed DSG. But the transmission of power according to this data seems to me far more efficient in Laura than TSi. I really had expected that with time and developments in technology, transmission losses should have been minimised or atleast remained the same.
psn is offline  
Old 12th September 2015, 12:24   #54
BHPian
 
winsler_srider's Avatar
 
Join Date: Jul 2015
Location: KL-07
Posts: 74
Thanked: 79 Times
Re: Race Dynamics dyno database of Stock cars

Quote:
Originally Posted by Racedynamics View Post
Maruti Suzuki Baleno

Measured power : 71.24 whp
Manufacturer claimed power: 94 bhp

Measured torque: 106.79 Nm
Manufacturer claimed torque: 130 Nm
...

Maruti Suzuki Swift Petrol (K Type)

Measured power : 69.72 whp
Manufacturer claimed power: 83 bhp

Measured torque: 82.57 Nm
Manufacturer claimed torque: 114 Nm

Attachment 1412420
Quote:
Originally Posted by Racedynamics View Post
Volkswagen Polo 1.2 Diesel

Measured power : 72.93 whp
Manufacturer claimed power: 74 bhp

Measured torque: 167.55 Nm
Manufacturer claimed torque: 180 Nm

Volkswagen Polo 1.2 GT TSI

Measured power : 89.67 whp
Manufacturer claimed power: 103 bhp

Measured torque: 128.95 Nm
Manufacturer claimed torque: 175 Nm


Volkswagen Polo 1.6 Petrol

Measured power : 89.48 whp
Manufacturer claimed power: 103 bhp

Measured torque: 122.36 Nm
Manufacturer claimed torque: 153 Nm
Hi Race Dynamics,

Thanks for sharing the dyno-run test results. I could see quite a good number of rides

1. BMW F10 530d
2. BMW F10 530d - M Sport
3. Chevrolet Cruze diesel
4. Chevrolet Optra Magnum diesel 2.0
5. Fiat Punto 1.3 diesel 75hp
6. Ford Fiesta Sport 1.6s petrol
7. Ford Ikon 1.6 petrol
8. Honda Accord 2.4 - 7th gen
9. Honda Brio Petrol
10. Honda City VTec (OHC)
11. Honda Civic
12. Hyundai Accent Viva 1.6 Petrol
13. Hyundai Elantra Fluidic Diesel
14. Hyundai Elantra CRDi Type - I
15. Hyundai Getz CRDi
16. Hyundai i20 (6 Speed) CRDi
17. Hyundai Verna Type - I Diesel
18. Hyundai Verna Fluidic Diesel
19. Mahindra Thar CRDe
20. Mahindra Verito Diesel
21. Mahindra XUV500
22. Maruti Suzuki Baleno
23. Maruti Suzuki Ertiga Diesel
24. Maruti Suzuki Esteem
25. Maruti Suzuki Swift Petrol (K Type)
26. Maruti Suzuki Zen Petrol
27. Mitsubishi Cedia
28. Skoda Laura 2.0 TDI AT Diesel
29. Skoda Octavia TDI Diesel Type - II
30. Tata Manza Diesel
31. Tata Zest Petrol
32. Toyota Innova
33. Volkswagen Polo 1.2 Diesel
34. Volkswagen Polo 1.2 GT TSI
35. Volkswagen Polo 1.6 Petrol

and their power available at wheels.

I was actually looking deep for numbers on DDIS & VTVT Swift hatch-back, their sedan versions, Grand Vitara 2008 model, Kizashi, Duster, Terrano, Ecosport. If you've got those numbers, please add that too to this fact list.

Purpose - looking for a used car.

regards,
winsler
winsler_srider is offline   (1) Thanks
Old 12th September 2015, 14:00   #55
BANNED
 
Join Date: Jul 2009
Location: roaming
Posts: 134
Thanked: 16 Times
Re: Race Dynamics dyno database of Stock cars

Any stats for the Figo D..?
ridinthru' is offline  
Old 12th September 2015, 18:08   #56
Senior - BHPian
 
Arjun Reddy's Avatar
 
Join Date: Jun 2013
Location: Bangalore
Posts: 1,529
Thanked: 2,891 Times
Race Dynamics dyno database of Stock cars

Awesome thread. Thanks for sharing.Have been waiting for this quite some time. Exhaustive work.

Good job Karthik and team. Clap!

Ford petrols really disappointed. Surprised with the Korean horses. Well done Hyundai.

It would be interesting if we can have a comparison graph between the fluidic Elantra, Cruise and the Octavia.

How come no Audis and Mercs?

Attached are my Punto 75 HP graphs with the Diestronics.

Race Dynamics dyno database of Stock cars-imageuploadedbyteambhp1442061103.561673.jpg
Attached Thumbnails
Race Dynamics dyno database of Stock cars-imageuploadedbyteambhp1442060989.693840.jpg  


Last edited by Arjun Reddy : 12th September 2015 at 18:31.
Arjun Reddy is offline   (2) Thanks
Old 13th September 2015, 08:37   #57
Senior - BHPian
 
kuttapan's Avatar
 
Join Date: May 2007
Location: Melbourne
Posts: 1,155
Thanked: 22 Times
Re: Race Dynamics dyno database of Stock cars

Quote:
Originally Posted by Racedynamics View Post
BMW F10 530d

Measured power : 194.1 whp
Manufacturer claimed power: 235 bhp

Measured torque: 362.1 Nm
Manufacturer claimed torque: 500 Nm

Comments - The undulation after 5k RPM is the autobox shift from 3rd to 4th

Attachment 1412295
Just wanted to get a clarification from racedynamics -

On a chasis dyno, what is normally measured, is tractive effort and not torque - Of course, you can derive the torque by factoring in additional variables like gear ratio etc. but your graph shows a dip between gears which to me means that it is a tractive effort graph and not a torque graph.

The plots are certainly instructive, but people reading will get mislead to compare absolute tractive effort values against manufacturer published torque figures.

For the uninitiated, tractive effort is very different from torque and the same car can produce different plots based on what gear it is being run on the chasis dyno - even tyre pressures and the state of the tyre can affect this value.

So, please be careful when comparing the charts and looking at absolute values. The curve itself can be useful to explain the behavior of a certain car, but the actual tractive effort values do not mean much. Where it could come into play is, for example, you are modifying the car and testing in between, under the same conditions. You would know if you are making a gain or not.

There is a reason manufacturers quote Engine dyno figures and not chasis dyno - Lesser variables and more consistent measurement(not to forget higher number values). But like Racedynamics pointed out, what a user wants from the car is what it puts out on the road, and to that end, a chasis dyno can be a pointer.
kuttapan is offline  
Old 14th September 2015, 07:50   #58
BANNED
 
Join Date: Jan 2014
Location: mum, kolkata
Posts: 1,230
Thanked: 1,634 Times
Re: Race Dynamics dyno database of Stock cars

Quote:
Originally Posted by Nithesh_M View Post
Quite honestly its pointless to compare dyno charts of cars taken years apart from them rolling off the production line. What would be beneficial here ...........This is why manufacturers quote crank hp coupled to an engine dynamometer at the factory. You eliminate more variables and get somewhat of an accurate picture of what the engine is doing. It won't be a 100% accurate either but it has less variables affecting than when using a rolling dyno.
Point taken - power measured at the crank represents the state of the engine (mechanical condition + ECU tinkering) neglecting all external losses. Power at the wheel is the net power available for traction.

Manufacturers invariably quote test bed figures with engines in prima donna condition and have little to do with real world figures, which (as stated eloquently elsewhere in the thread) is inclusive of all losses post flywheel. Many of which are driver centric as well as indicative of the state of maintenance.
shashanka is offline  
Old 14th September 2015, 09:51   #59
BHPian
 
amiya.c's Avatar
 
Join Date: Apr 2013
Location: Bangalore
Posts: 106
Thanked: 128 Times
Re: Race Dynamics dyno database of Stock cars

An excellent thread for enthusiasts like me who first look for the torque and bhp figures only before looking at anything else in a car 
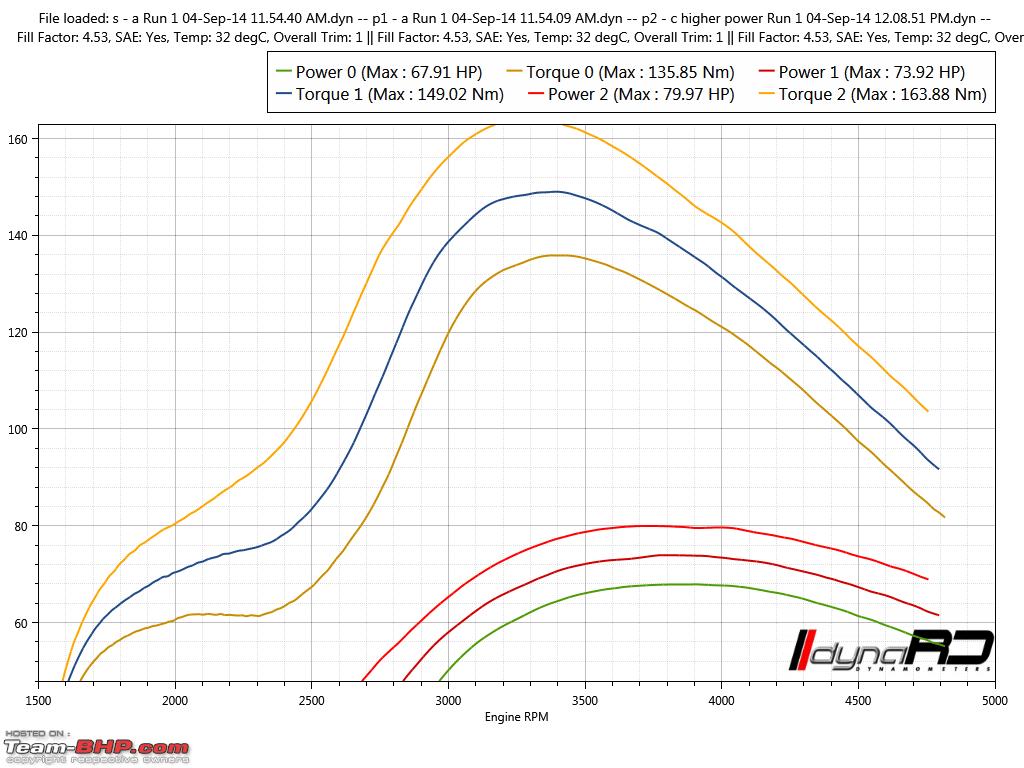
. I used to surf the net and the manufacturer's website for these dyano graphs but there was not much information available. A big thankyou to Racedynamics.
amiya.c is offline   (1) Thanks
Old 14th September 2015, 10:31   #60
BANNED
 
Join Date: Oct 2012
Location: Bangalore
Posts: 115
Thanked: 471 Times
Re: Race Dynamics dyno database of Stock cars

Quote:
Originally Posted by kuttapan View Post
Just wanted to get a clarification from racedynamics -

On a chasis dyno, what is normally measured, is tractive effort and not torque - Of course, you can derive the torque by factoring in additional variables like gear ratio etc. but your graph shows a dip between gears which to me means that it is a tractive effort graph and not a torque graph.

The plots are certainly instructive, but people reading will get mislead to compare absolute tractive effort values against manufacturer published torque figures.

For the uninitiated, tractive effort is very different from torque and the same car can produce different plots based on what gear it is being run on the chasis dyno - even tyre pressures and the state of the tyre can affect this value.

So, please be careful when comparing the charts and looking at absolute values. The curve itself can be useful to explain the behavior of a certain car, but the actual tractive effort values do not mean much. Where it could come into play is, for example, you are modifying the car and testing in between, under the same conditions. You would know if you are making a gain or not.

There is a reason manufacturers quote Engine dyno figures and not chasis dyno - Lesser variables and more consistent measurement(not to forget higher number values). But like Racedynamics pointed out, what a user wants from the car is what it puts out on the road, and to that end, a chasis dyno can be a pointer.
As you rightly suggested, Tractive force is used to compute engine torque as Tractive forces are a function of engine torque. The dip you see is actually two events - the auto transmission shifting to the next gear and the dyno operator lifting off the throttle. The method for a vehicle with a fixed transmission ratio is to lock the drive ratio for a given gear and do the test. For those which use a CVT,variomatics or any other forms of variable transmissions, the drive ratio can be managed with true engine RPM sensing and rolling road speeds.

Manufacturers have different approaches to computing torque request and subsequent delivery, there are cases wherein the this torque request has been computed to true figures at wheels.

On a side note, added the stats for the Nissan 350Z.

Last edited by Gannu_1 : 14th September 2015 at 12:02. Reason: 350Z. :)
Racedynamics is offline   (1) Thanks
Reply

Most Viewed


Copyright ©2000 - 2024, Team-BHP.com
Proudly powered by E2E Networks